

This article addresses a topic easily overshadowed by startup speed and smoothness: first-frame interaction response. It asks how long the screen takes to provide the first frame of feedback after a user action. Complete page loading and stability later in an animation require other metrics.
After tapping a button, how long until its pressed state appears? After tapping a WeChat conversation, how long until the first frame of the conversation page starts moving? After swiping a list, how long until its content follows the finger? These questions relate to slow startup and dropped frames, but need their own measurement definitions.
We use Perfetto to break down this interval: from InputReader read_time, through the App receiving the event, to the first frame’s present. The primary metric, input_to_present_ms, measures only input read to the associated frame’s present. It does not cover touch IC latency, delays before driver reporting, display scanning, or panel response. By the end, you should be able to define a start, endpoint, capture configuration, SQL metrics, and supplementary App markers for a tap or scroll scenario.
The article examines response latency through four independent measurements—read/dispatch, handling, ACK→first frame, and scroll responsiveness. Each comes with capture configuration, the first tracks to inspect in the UI, and SQL. It then covers five common attribution paths and the respective boundaries of high-speed cameras and Perfetto.
Perfetto Series Catalog
- Android Perfetto Series Catalog
- Android Perfetto Series 1: Introduction to Perfetto
- Android Perfetto Series 2: Capturing Perfetto Traces
- Android Perfetto Series 3: Familiarizing with the Perfetto View
- Android Perfetto Series 4: Opening Large Traces via Command Line
- Android Perfetto Series 5: Choreographer-based Rendering Flow
- Android Perfetto Series 6: Why 120Hz? Advantages and Challenges
- Android Perfetto Series 7: MainThread and RenderThread Deep Dive
- Android Perfetto Series 8: Understanding Vsync and Performance Analysis
- Android Perfetto Series 9: Interpreting CPU Information
- Android Perfetto Series 10: Binder Scheduling and Lock Contention
- Android Perfetto Series 11: PerfettoSQL, Trace Processor and Regression Detection
- Android Perfetto Series 12: Trace Dataflow and Data Loss
- Android Perfetto Series 13: Perfetto SDK, Track Event and App Field Traces
- Android Perfetto Series 14: heapprofd and Memory Profiling
- Android Perfetto Series 15: Boot Traces and Long-running Field Tracing
- Android Perfetto Series 16: GPU, Power Counters and Hardware Bottlenecks
- Android Perfetto Series 17: Scenario Automation and Platform Tracing
- Android Perfetto Series 18: Input Response Latency
- Video (Bilibili) - Android Perfetto Basics and Case Studies
- Video (Bilibili) - Android Perfetto: Trace Graph Types - AOSP, WebView, Flutter + OEM System Optimization
This Article Covers Only the First Frame After an Interaction
The earlier Systrace response-speed series covered response latency more broadly: startup, navigation, screen on/off, unlocking, a busy system, Binder, and other scenarios. The smoothness series covered the stability of consecutive frames. Parts 07 and 08 of the Perfetto series also broke down the frame path through MainThread, RenderThread, Vsync, and SurfaceFlinger.
This article adds just one segment:
1 | User input |
We consistently call the primary metric input_to_present_ms: from android_input_events.read_time to the associated frame’s present, represented by end_to_end_latency_dur in SQL. It answers “how long after the tap does the first frame of feedback appear?”, rather than “how long until the whole page loads?” or “does the animation drop frames?” The standard library’s present is a candidate association: is_speculative_frame=false means only that an input-handling slice overlaps a doFrame on the same thread. It proves neither business causality nor a visual change on the target layer. Queries below therefore output estimated_input_to_present_ms. Only after separately checking the target layer, frame token, actual present, and business state can it be promoted to confirmed input_to_present_ms.
If you start from event_time or a business marker, report a separate field; do not mix it with input_to_present_ms for comparisons.
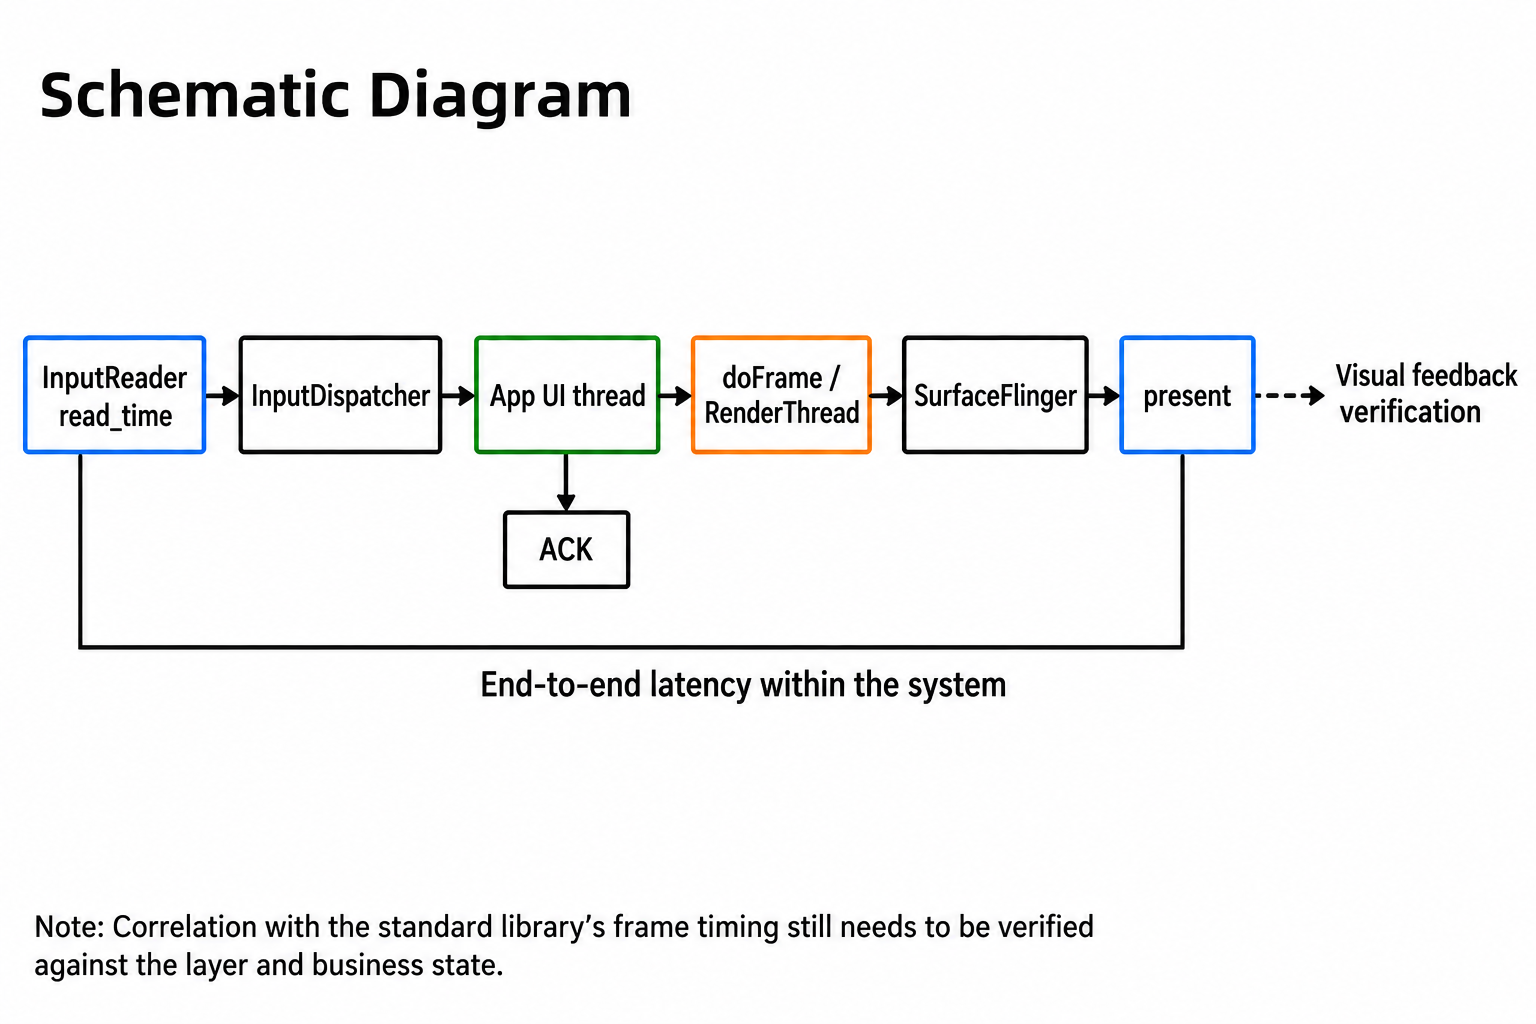
Illustration: ACK and frame display are different stages. A candidate present still needs confirmation against the layer and business state; it cannot directly stand for the first user-visible frame.
Break Response Latency into Four Metrics
Discussions of slow response often mix different concepts. Before analyzing an interaction, separate it into four metrics.
| Metric | Start | End | Question it answers |
|---|---|---|---|
| Dispatch latency | InputDispatcher sends the event | App receives the event | Are system dispatch and InputChannel slow? |
| Handling latency | App receives the event | App sends ACK | Is App input handling slow? |
input_to_present_ms |
Input read (read_time) |
Associated frame present | How soon does the user see the first frame of feedback? |
| Completion latency | Business trigger | Page or animation becomes stable | How long does the entire operation take? |
Users are especially sensitive to input_to_present_ms. Fast initial feedback followed by content arriving in stages feels responsive. Slow initial feedback can feel like “nothing happened when I tapped,” even if the subsequent animation is stable.
Taps and scrolls also have different endpoints:
- Button tap: the endpoint may be the pressed-state present, the first popup frame’s present, or the first page-transition frame’s present.
- Conversation tap: it may be the first frame of the conversation page’s entry animation, or completion of drawing the first message’s content.
- Finger scroll: it should be the present at which content first visibly moves.
Perfetto helps locate internal system timing, but whether the first frame actually contains a visual change often needs calibration with App markers or external visual tools.
Also distinguish three “input times”:
event_time: when the input event occurred. Earlier thanread_time, but still not the touch firmware, electrical signal, or an externally visible starting point.read_time: when InputReader reads the event. The end-to-end field inandroid_input_eventsmeasures from here to present.dispatch_ts/receive_ts: when InputDispatcher sends the event and the App receives it, used to separate system dispatch from App handling.
Do not label all of these “from the tap” in reports. If measurement starts at read_time, say input read; if it starts at a business click handler, say App marker. Numbers with different starting points are not directly comparable.
Before writing SQL, establish the scenario’s object dictionary. At minimum, include the target package, InputChannel, target window, target layer, business markers, and expected endpoint:
1 | scenario_id: conversation_click |
Automation can first generate candidate objects from package and window names, but reports should use only manually confirmed objects. Otherwise, when a trace contains multiple windows, popups, SurfaceViews, or overlays, SQL can easily associate an input event with the wrong layer.
Handle multiple displays and foldables explicitly in the dictionary. Input events are dispatched by display: external monitors, multi-display automotive systems, and a foldable’s inner and outer displays can contain windows and channels with identical names at the same time. android_motion_events / android_key_events have a display_id column, allowing event IDs to identify the destination display. The round-trip table, android_input_events, has no display column. When raw inputevent data is available, normalize the event ID representation before cross-checking those two tables. ATrace string IDs may be hexadecimal, whereas raw event_id values are integers; do not directly join the columns as equal strings. Folding and unfolding can also trigger display switches and window recreation, replacing layer and channel names. Do not combine different postures into one baseline. Record posture (folded/unfolded) as a separate dimension in the scenario dictionary, and compare runs only within the same posture.
Version interaction scenarios as schemas too. A minimal contract for a tap scenario can look like this:
1 | schema_version: input_response_v1 |
For scrolling, refine the endpoint from “frame present” to “the present where content first visibly moves”:
1 | schema_version: input_response_v1 |
Trace Capture Configuration
Capture has two tiers:
| Preset | Build/scenario | Data sources | Reporting scope |
|---|---|---|---|
lab_input_debug |
userdebug/eng, short laboratory window | input/view/gfx ATrace, FrameTimeline, sched, App markers, plus raw android.input.inputevent |
Round trip + candidate input-to-present; visual endpoint confirmed separately |
field_input_response_low_overhead |
user/field, platform-controlled capture | App markers, FrameTimeline/sched, input/view ATrace where available by version, trigger metadata | Round trip when ATrace is complete; otherwise fall back to App-marker measurement |
Local or laboratory analysis can enable the more complete input data source. This short-trace configuration reproduces tap/scroll response, with particular attention to android.input.inputevent and atrace_categories: "input":
1 | buffers { |
android.input.inputevent targets debuggable system builds—controlled environments such as userdebug/eng. TRACE_MODE_TRACE_ALL records input events handled by the system and is suitable only for local devices and testing.
Do not depend on android.input.inputevent on field/user builds. To reduce privacy exposure even in a debuggable, controlled environment, use TRACE_MODE_USE_RULES, strict matching rules, review of secure/IME/spy windows, and access controls. Rules mode does not turn it into an ordinary production-capture capability. Input events may be delivered to the foreground window, SystemUI, IME, or spy windows simultaneously; poorly designed match_any_packages / match_all_packages rules can broaden collection scope.
Field presets must include secure windows, IME, spy windows, multi-target dispatch, redaction, retention periods, and access controls in their review criteria.
An ordinary App cannot start system ftrace, FrameTimeline, or android.input.inputevent sessions itself. <profileable android:shell="true" /> is useful for allowing local profiling of release builds with CPU/memory profilers. App tracing is available by default for all Apps on Android 12+; on Android 11 and earlier, android.os.Trace still requires attention to profileable/debuggable boundaries.
It does not, however, grant an ordinary App on a user build permission to start system inputevent, ftrace, or SurfaceFlinger sessions itself.
android.input includes two different sources. android_key_events/android_motion_events come from raw android.input.inputevent. In contrast, android_input_events reconstructs round trips and frame associations from ATrace slices such as sendMessage/receiveMessage, deliverInputEvent, and UnwantedInteractionBlocker::notifyMotion. Do not conflate them. Round trips may exist without raw inputevent enabled; enabling only raw inputevent without ATrace does not automatically produce round trips. Actual availability depends on the system version, the presence of these instrumentation points, and whether categories such as input/view/gfx were captured.
Define fallbacks in advance:
| Missing signal | What can still be reported | What cannot be reported |
|---|---|---|
Raw android.input.inputevent missing |
Complete ATrace can still reconstruct round trips and candidate frame associations | Raw motion/key details and display information |
| Input ATrace send/receive or ACK slices missing | App markers, FrameTimeline/scheduling context | Complete round trips; raw inputevent tables cannot directly replace them |
| FrameTimeline missing | Input round trips, App markers, thread and SurfaceFlinger clues | Associated frame, input_to_present_ms |
| SurfaceView/games/video | App markers, layers, external video, vendor tools | First visible change established solely through FrameTimeline |
| Data loss / clock sync anomalies | Local observations from surviving evidence | Strong conclusions and precise cross-source durations |
State FrameTimeline’s limits too: it requires Android 12 or later. The official documentation currently says SurfaceView is unsupported, so video, games, and maps cannot rely on FrameTimeline alone to identify the first visible frame change. Calibrate with layers, App markers, external video, or vendor graphics tools.
input_to_present_ms shows only that an input event was associated with a frame’s present. Whether this was the target UI’s first visible change still needs confirmation through the target layer, business markers, scroll counters, screenshots/video, or domain tools. A populated frame_id is not sufficient proof of visual change either.
For deeper local investigation, Winscope’s SurfaceFlinger layers/transactions sources can help inspect window and layer state. These sources can be heavy, particularly MODE_ACTIVE and buffer/HWC trace flags, which substantially increase data volume. Reserve them for short laboratory traces.
Field investigations still rely on the controlled presets, triggers, business markers, and privacy rules from Parts 13, 15, and 17.
Run data-quality checks immediately after capture. Input analysis depends heavily on timing order and FrameTimeline associations; ftrace or central-buffer data loss requires downgrading the report:
1 | SELECT name, idx, severity, source, value |
Group these anomalies under inputevent, FrameTimeline, ftrace/sched, central_buffer, and clock_sync. An anomaly in any critical group must lower the evidence grade for input_to_present_ms.
linux.sys_stats adds CPU frequency samples, but frequency assessment still needs idle state, cluster/cpuset, uclamp, thermal conditions, the frequency state immediately before the window, and whether the target thread actually ran on the relevant CPU/cluster. This preset does not enable IRQ, softirq, or workqueue events by default. If you suspect hardirq, kworker, or softirq interference, use a separate short-window specialist preset.
Keep IRQ/softirq/workqueue events in that short-window preset only: irq/irq_handler_entry, irq/irq_handler_exit, irq/softirq_entry, irq/softirq_exit, irq/softirq_raise, workqueue/workqueue_execute_start, and workqueue/workqueue_execute_end. Check ftrace overrun/dropped after capture; do not put these events in the default field preset.
Which Tracks to Inspect First in Perfetto UI
For a tap or scroll response, inspect in this order:
- InputReader / InputDispatcher: verify that the event was read and dispatched to the target window.
- App main thread: verify arrival and whether the thread became Running promptly.
Choreographer#doFrame: determine whether the state change advances into the next frame throughInput,Insets Animation,Animation,Traversal, orCommit. Input receive/ACK need not occur inside doFrame; batched input may also be consumed throughCALLBACK_INPUT.- RenderThread: after the UI thread submits work, check for stalls in stages such as
syncFrameState,DrawFrame,dequeueBuffer, andqueueBuffer. - FrameTimeline: check the associated frame’s expected/actual timelines, token,
layer_name, and association method. - SurfaceFlinger: check timely buffer latching and whether HWC/GPU composition, acquire/release/present fences, or other layers affect final presentation.
- CPU scheduling/frequency: check the main thread, RenderThread, and InputDispatcher for Runnable waits, insufficient frequency, or abnormal CPU migration.
Do not start by guessing from the longest slice. Connect the input event to the first frame of feedback, then determine where the time went.
Tap Scenarios: From DOWN/UP to the First Frame
Choose the starting point first. Products define “tap response” differently.
| Scenario | Recommended start | Recommended end |
|---|---|---|
| Button pressed state | ACTION_DOWN or input read | First pressed-state frame present |
| Tap confirmation | ACTION_UP or click handler | Target UI’s first frame present |
| Page navigation | Click handler / business marker | First transition frame present |
| Content available | Click handler / business marker | First-screen content marker |
For “tap a conversation to enter the chat page,” inspect Perfetto in these steps:
- Find the corresponding ACTION_UP in
android_input_eventsor on the InputDispatcher track. - Measure dispatch to App receive to determine whether system dispatch is slow.
- Check whether the App main thread is scheduled promptly after receiving the event.
- Check the click handler for Binder, IO, lock waits, synchronous layout, and image decoding.
- Look for waits introduced by the
startActivityBinder call, Activity launch, window creation, focus changes, starting window, transition, and target-layer visibility. - Check whether the next
Choreographer#doFrameadvances state throughAnimation,Traversal, orCommit. - Inspect RenderThread, FrameTimeline, and SurfaceFlinger to confirm the associated frame actually presents.
- Return to App markers and the object dictionary to confirm that this is the conversation page’s first user-visible frame.
The easiest mistake here is that Perfetto can show an App drawing a frame that contains no visual change. The end of the App actual timeline means the App completed and submitted the frame; it does not mean the user has seen it.
To confirm first-frame feedback, return to the frame associated with android_input_events.end_to_end_latency_dur, the SurfaceFlinger actual/display frame, layer_name, token/flow, and external evidence. Without business markers, the analyst must judge from UI screenshots, layer names, or external video.
Specify the event contract before implementing it:
| Event | Type | Thread | Meaning | Report fields | Privacy |
|---|---|---|---|---|---|
Conversation#Click |
slice | UI thread | Click-handler execution window | business_marker_ts, click_handler_dur |
No conversation ID |
Conversation#TransitionStart |
short slice milestone | UI thread | Business-defined transition start | transition_marker_ts |
No page parameters |
Conversation#FirstContentDrawn |
short slice milestone | UI thread / render callback | Candidate business completion of first-screen content | content_marker_ts, content_marker_seen |
No content text |
Feed#ScrollOffsetY |
counter | UI thread | Visible list displacement | first_offset_change_ts, offset_delta_px |
Numeric values only |
Conversation#FirstContentDrawn is a business_state_marker, not a visual_endpoint. The final report must include present_ts, associated_frame_id, layer_name, and association_method. Without a present association, report only content_marker_seen=true; do not output input_to_present_ms.
The following code adds three business markers to the conversation-tap scenario. Pay attention to naming: event names are fixed, and dynamic IDs do not enter trace sections.
1 | fun onConversationClick(conversationId: String) { |
These markers represent click handling, transition start, and first-screen content completion. The latter two are milestone-style short slices: reports use only their ts, not dur as business duration. Use Perfetto SDK Track Event when you need strict instants, arguments, or flows. Perfetto supplies system timing; markers supply business meaning. The endpoint remains the associated frame’s present.
android.os.Trace / ATrace work well for stable slice names and counters. Do not concatenate dynamic conversation IDs, page IDs, or experiment groups into section names. For arguments, flows, or cross-thread tracks, use Perfetto SDK Track Event from Part 13, or put business metadata in the same case package.
A marker represents business state only; present time comes from the associated frame. Report business_marker_ts, associated_frame_id, present_ts, and association_method separately.
Scroll Scenarios: From the First Effective MOVE to Content Displacement
Scroll response is easier to misinterpret than tap response. When a finger first moves, the system receives many MOVE events, but the App may not yet have crossed touch slop. Event coalescing, sampling, and Vsync cadence may also mean that only a later frame produces actual content displacement.
The recommended definition is:
1 | First ACTION_MOVE considered effective by business logic -> Present where content first visibly moves |
Analysis steps:
- Find the MOVE sequence after ACTION_DOWN.
- Exclude small MOVE events within touch slop and select the MOVE that the business logic treats as the start of scrolling.
- Check whether the App main thread receives this MOVE and ACKs promptly.
- Check whether the
Inputstage ofChoreographer#doFrameupdates the scroll offset. - Check whether the next frame is submitted to RenderThread.
- Check the FrameTimeline present time.
- Confirm content displacement with an App counter or external video.
Perfetto cannot always tell “how far the content moved.” Apps you control can add a lightweight counter. The following records each nonzero consumed displacement, preserving the first change’s timestamp. If updates must be coalesced per frame, add frame-level scheduling separately and record the resulting sampling delay; do not assume onScrolled is called only once per frame. Report first_effective_move_ts, first_offset_change_ts, offset_delta_px, touch_slop_px, and sample_policy together.
1 | var gestureScrollY = 0L // Reset at the start of a new gesture and record a baseline counter. |
android.os.Trace.setCounter(String, long) is available from API 29. Projects with a lower minSdk need AndroidX tracing or their own version guard. For a large scroll-offset range, use an SDK Track Event counter or bucketed values. Do not flood the trace with counters for every layout detail. Record only user-visible state such as scroll offset, player position, or the current scene ID.
computeVerticalScrollOffset() is a scrollbar estimate whose units depend on the LayoutManager; it should not be treated directly as exact displacement in pixels. Here, accumulating dy gives the content displacement consumed by this gesture. It still does not prove that the screen has moved. Item animation, nested scrolling, and data refresh need separate calibration. First calculate move_to_offset_change_ms, then verify the frame that actually carries that state and its present. Do not arbitrarily use “the next frame” as the visual endpoint.
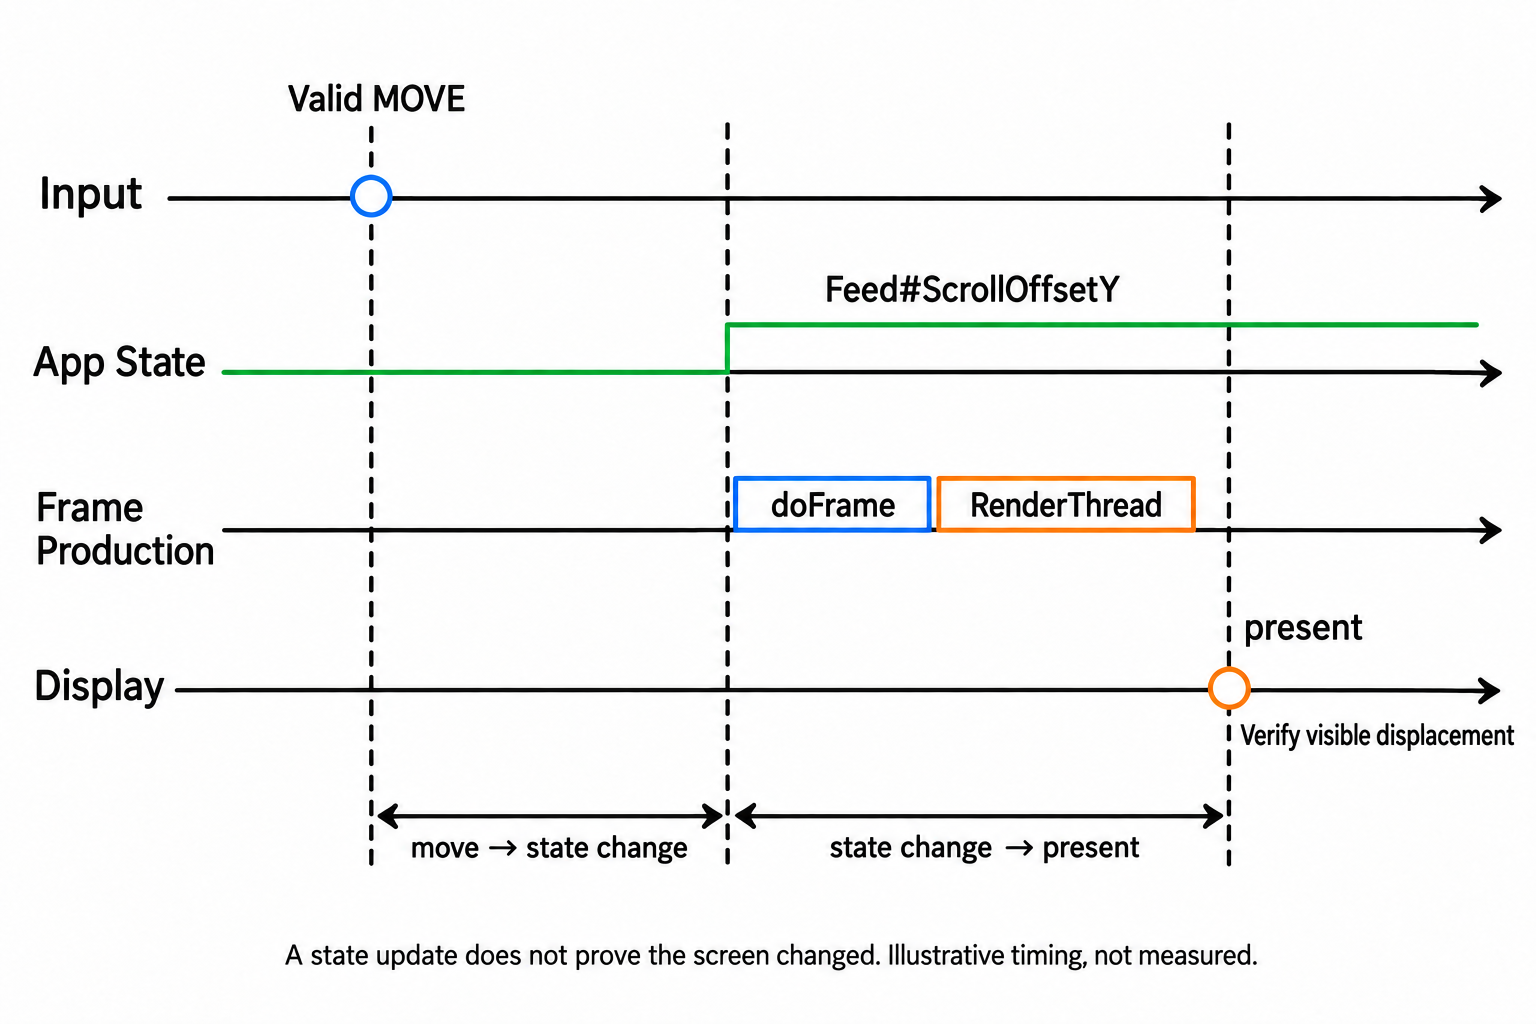
Illustration: first measure effective MOVE to scroll-state change, then verify the frame carrying that state and its present. A counter update does not prove that the screen has moved.
Quantifying Input Latency with SQL
First INCLUDE PERFETTO MODULE android.input, then check whether input ATrace can form send → receive → finish → ACK. The current implementation inner-joins these four stages. If any stage is missing, the entire event row may disappear; in particular, this cannot rule out an ANR involving a missing ACK. read_time and frame association are additional information and may be null. Round trips can still exist without FrameTimeline.
This article does not use Chrome EventLatency. Android App analysis uses android.input / android_input_events and FrameTimeline; analyze WebView/Chrome scenarios separately with Chrome modules.
Choose the target input event first, so DOWN/MOVE/UP events, IME, overlays, or multiple windows within the same process are not mixed together.
Before proceeding, inspect how actions actually appear in this trace rather than copying Android constant names. event_action is extracted from slice names in the trace. Perfetto’s own test data uses values such as HOVER_MOVE and SCROLL without an ACTION_ prefix. event_type may be MOTION or a raw value such as 0x1, depending on the system version’s InputTransport ATrace naming. It cannot tell you whether the raw inputevent data source was enabled:
1 | INCLUDE PERFETTO MODULE android.input; |
After confirming the values, match them exactly. *UP also matches POINTER_UP, so it cannot select single-finger taps. The following selects UP according to the current slice naming and fixes the click marker to the target process. The marker and input channel must correspond to the source window receiving the tap, which is not necessarily the destination Activity after navigation:
1 | INCLUDE PERFETTO MODULE android.input; |
Once the target event is selected, inspect the input round trip. Focus on dispatch, handling, ACK, and input-to-present:
1 | INCLUDE PERFETTO MODULE android.input; |
The fields mean:
dispatch_latency_dur: InputDispatcher sending the event to the App receiving it.read_to_dispatch_ms: InputReader reading the event to InputDispatcher sending it. This can expose pre-dispatch queuing, policy/interception, or waits before dispatch.handling_latency_dur: the framework interval from the App input channel receiving the event to finish/ACK. This is not exclusively click-handler time. To locate business handling, split it further using ViewRootImpl/InputStage slices, App markers, or click-handler sections.ack_latency_dur: the App sending ACK to the system receiving ACK.total_latency_dur: dispatch to ACK completion.end_to_end_latency_dur: the difference between input read and the standard library’s candidate present;NULLwhen association fails. It needs additional checks of the target layer, frame token, frame ordering, and nonnegative duration.is_speculative_frame: true means a future doFrame on the same thread was selected; false means input handling overlaps doFrame in time. It does not verify visual changes on the target layer. The current implementation then looks for present through subsequent non-dropped frames in the same process. Do not treat this as a strict causal chain from input to a specific surface token.
A NULL end_to_end_latency_dur does not necessarily mean no visual feedback occurred. The event may not have been associated with a FrameTimeline frame, or feedback may have occurred on a SurfaceView, game engine, or another layer. Return to App markers, SurfaceFlinger, external video, or domain tools in these cases; do not translate NULL into “nothing was drawn.”
When investigating slow input, first query slow round-trip events without filtering end_to_end_latency_dur:
1 | INCLUDE PERFETTO MODULE android.input; |
The round-trip query selects the window with COALESCE(read_time, dispatch_ts) so events that retain dispatch/ACK are not filtered out when read_time is missing. Require end_to_end_latency_dur >= 0 additionally only when ranking candidate input-to-present durations. Association flags, the target layer, and actual present still need review.
If read_to_dispatch_ms is high, first inspect InputDispatcher state, window targets, policy/interception, focused-window waits, and IME/spy/secure windows, then system_server scheduling. Do not jump directly from high read-to-dispatch to a CPU/frequency conclusion. If handling_ms is high, return first to the App main thread and inspect ViewRootImpl/InputStage, the click handler, Binder, locks, and IO.
If handling_ms is low but input_to_present_ms is high, prioritize post-ACK App/Framework asynchronous paths, Activity/Fragment transactions, data callbacks, next-frame production, RenderThread, FrameTimeline, SurfaceFlinger, and scheduling.
Separate Running from Runnable in scheduling analysis. The prerequisites are complete sched_switch and wakeup/waking events, with no ftrace_cpu_has_data_loss, overrun/dropped, or ftrace_setup_errors. Otherwise, say only “Runnable/Running appears in the surviving evidence,” not “there was no scheduling wait.”
This example covers App main, RenderThread, InputReader/InputDispatcher in system_server, WindowManager-related threads, and SurfaceFlinger. In production engineering, drive selection through scenario_objects with role in ('input_reader','input_dispatcher','window_manager','app_main','render_thread','surfaceflinger'); thread names should be candidates only:
1 | WITH target_window AS ( |
This uses the Running/Runnable states in thread_state for consistent aggregation, leaving durations blank when records are missing or cover only part of the window. full means interval coverage only and does not replace stats checks. If a thread lives for only part of the window, narrow the window before calculating.
High Runnable time means the thread wants to run but has not obtained CPU time. First inspect other runnable tasks, RT tasks, cgroup/cpuset, uclamp/capacity, thermal conditions, CPU migration, and frequency. High Running time means the thread is already consuming CPU time; then inspect function-level hotspots, Binder, locks, or layout/drawing. To understand wakeup direction, inspect wakeup information in thread_state, IRQ context, or adjacent ftrace events. A busy CPU alone is not enough for a conclusion.
Common Attribution Paths
Slow Read/Dispatch
This usually appears as high read_to_dispatch_ms or dispatch_latency_dur. Check:
- Queuing between InputReader and InputDispatcher.
- Whether InputDispatcher is busy.
- Whether system_server is waiting in Runnable state.
- Abnormal window focus, target-window, or InputChannel state.
- Policy/interception, IME, overlays, focused-window waits, or WindowManager state transitions.
- CPU impact from other runnable tasks, RT tasks, cgroup/cpuset/uclamp, thermal conditions, or migration policy.
These issues tend to be platform-side; the App can supply page and interaction context.
Slow Handling
This usually appears as high handling_latency_dur. Check:
- Whether the App main thread remains Running for a long time after receiving input.
- Heavy computation during the
Inputstage. - Synchronous Binder calls, file reads, lock waits, or waits for network callbacks in the click handler.
- Synchronous layout, image decoding, complex Compose recomposition, or extensive RecyclerView binding.
App markers and main-thread slices can locate most of these issues.
Fast ACK, Slow First Frame
This is common: the App ACKs input quickly, but feedback still feels slow. Check:
- Whether the App failed to request the next frame or requested it too late.
- Whether it waits after ACK for a Binder callback, Activity/Fragment transaction, data callback, or window switch.
- Whether
Animation/Traversalis scheduled for a later Vsync. - Whether RenderThread CPU work stalls in
syncFrameStateorDrawFrame. - Whether
dequeueBuffer/queueBufferindicates BufferQueue backpressure. - Whether App GPU completion, acquire/release fences, or present fences hold up the frame.
- Whether SurfaceFlinger/HWC/GPU composition makes the display frame later than expected.
- Whether the main thread or RenderThread waits for CPU in Runnable state.
Analyze the input round trip and frame production separately. A fast ACK means only that the App has finished handling the input; it does not mean the first frame has appeared.
ANRs and Sub-ANR Delays
Most slow interaction responses are sub-ANR problems: the user already notices the delay, but it has not reached the system’s ANR threshold. Examine input ANRs in two main categories:
- The event was sent to a connection, but the App does not ACK for a long time. This usually appears as abnormal
handling_latency_duror ACK-related timing. - A focused event keeps waiting for a focused window. Inspect WindowManager / ActivityTaskManager, window creation, focus changes, and InputDispatcher state.
“Fast ACK, slow first frame” generally does not trigger an input ANR because the input event has already been handled. It is more likely a first-frame production or window-visibility issue.
Scrolling Does Not Follow the Finger
This often appears as delayed displacement in the first frame, followed by stable subsequent frames. Check:
- Time from the first effective MOVE to a scroll-offset counter change.
- Time from the scroll-offset change to present.
- Whether MOVE events were coalesced, or the App waited until the next Vsync to handle them.
- Whether a Runnable wait on the main thread made the first frame miss the current Vsync.
- Whether subsequent FrameTimeline frames are stable. If so, the main problem is initial latency.
Avoid looking only at jank count. When users say scrolling “does not follow my finger,” they often mean input-to-first-frame delay.
Boundaries of High-Speed Cameras and Perfetto
Perfetto records internal system timing. What the user sees also includes touch sampling, touch firmware processing, display scanning, panel response, and error from external recording. External visual measurement remains necessary for competitor comparisons, acceptance testing, or comparisons across vendors.
The recommended combination is:
1 | High-speed camera / robotic touch actuator: |
External measurement provides the result, Perfetto provides the cause, and App markers provide business meaning. Together they move response analysis beyond “it feels slow.”
A minimal walkthrough should look like this: locate the input_event_id for ACTION_UP; observe handling_ms = 18, read_to_dispatch_ms = 3, and dispatch_ms = 4; then see that the candidate frame arrives 50ms after the system receives ACK. Within that interval, the App main thread is Runnable for 21ms before doFrame, and FrameTimeline shows the associated frame missed one vsync.
This evidence supports “App main-thread scheduling wait likely delayed the first frame by one refresh interval.” But if is_speculative_frame = true or no external video exists, it cannot support “confirmed user-visible latency of 76ms.”
A response-latency report can use this fixed format:
1 | scenario: conversation click |
This format requires the report to state its start, end, breakdown, evidence, and boundaries together. Evidence grades are fixed as confirmed, likely, excluded, degraded, and unknown; use these English values consistently in report fields. is_speculative_frame = true, missing FrameTimeline, missing external video, data loss, and fallback paths all lower the grade. A response-latency report cannot provide only a total duration: the total describes the delay perceived by the user, while the breakdown identifies where engineers should investigate. Without external measurement, report only internal system latency, not absolute user-visible latency.
Bringing It Together
The analysis sequence for first-frame interaction response can be standardized:
- Define the start: DOWN, UP, effective MOVE, or business click.
- Define the end: first pressed-state frame, first transition frame, first content displacement, or first-screen content completion.
- Use
android_input_eventsto separateread_to_dispatch, dispatch, handling, ACK, andinput_to_present_ms. - Use App markers to describe business state and the associated frame’s present as the screen endpoint.
- Use FrameTimeline, RenderThread, SurfaceFlinger, and CPU scheduling to explain why the first frame is early or late.
- Calibrate user-visible latency with a high-speed camera.
Startup speed covers a long scenario, smoothness covers stability across consecutive frames, and first-frame interaction response covers the first feedback after a user action. Keeping them separate makes the Perfetto evidence clear.
References
- PerfettoSQL standard library - android.input
- TraceConfig reference - AndroidInputEventConfig
- Android Jank detection with FrameTimeline
- ATrace: Android system and app trace events
- Track events
- Trace configuration
- CPU Scheduling events
- Buffers and dataflow
- Capture traces with adb commands - Input
- Android
<profileable>manifest element - ANR detection in InputDispatcher
- ViewRootImpl input pipeline
Source revision checked: b23c67be1159e3f0b0657bd97be9e139e0d8ee2c (2026-09-19).
About Me and the Blog
Follow Android Performance.