

The hardest part of a memory problem is that a rising number does not immediately tell you what is growing. dumpsys meminfo provides RSS/PSS, and a Java heap dump reveals object retention relationships. But for JNI/C++, CPU-side Skia/Bitmap allocations, and native wrappers in media players, you often also need to know which call stack issued the malloc/new request.
This article covers heapprofd. Its value is bringing native allocations, frees, and call stacks into a Perfetto trace, where you can inspect them alongside application events, thread scheduling, and Binder on the same timeline.
Use heapprofd after confirming the trend. First establish it with RSS/PSS, meminfo, or production monitoring; then use heapprofd to locate malloc/new call stacks. This article does not address Java object references or graphics backing memory.
We will cover when to use heapprofd, how to capture a profile, how to read it in the UI and SQL, how to interpret sampling intervals and symbolization, and finally what to check before publishing a report.
Perfetto Series Catalog
- Android Perfetto Series Catalog
- Android Perfetto Series 1: Introduction to Perfetto
- Android Perfetto Series 2: Capturing Perfetto Traces
- Android Perfetto Series 3: Familiarizing with the Perfetto View
- Android Perfetto Series 4: Opening Large Traces via Command Line
- Android Perfetto Series 5: Choreographer-based Rendering Flow
- Android Perfetto Series 6: Why 120Hz? Advantages and Challenges
- Android Perfetto Series 7: MainThread and RenderThread Deep Dive
- Android Perfetto Series 8: Understanding Vsync and Performance Analysis
- Android Perfetto Series 9: Interpreting CPU Information
- Android Perfetto Series 10: Binder Scheduling and Lock Contention
- Android Perfetto Series 11: PerfettoSQL, Trace Processor and Regression Detection
- Android Perfetto Series 12: Trace Dataflow and Data Loss
- Android Perfetto Series 13: Perfetto SDK, Track Event and App Field Traces
- Android Perfetto Series 14: heapprofd and Memory Profiling
- Android Perfetto Series 15: Boot Traces and Long-running Field Tracing
- Android Perfetto Series 16: GPU, Power Counters and Hardware Bottlenecks
- Android Perfetto Series 17: Scenario Automation and Platform Tracing
- Android Perfetto Series 18: Input Response Latency
- Video (Bilibili) - Android Perfetto Basics and Case Studies
- Video (Bilibili) - Android Perfetto: Trace Graph Types - AOSP, WebView, Flutter + OEM System Optimization
Keep Memory Accounting Categories Separate
Before capturing a heapprofd profile, separate memory data into several categories. Many incorrect conclusions come from mixing them together.
| Data | Common sources | Questions it answers |
|---|---|---|
| Process RSS / swap trends | linux.process_stats |
Are the target process’s RSS, anon/file RSS, swap, or oom_score_adj changing? |
| Process PSS / Private Dirty | dumpsys meminfo, /proc/<pid>/smaps_rollup, process_stats_config.scan_smaps_rollup |
Are PSS, Private Dirty, or SwapPss rising? scan_smaps_rollup is subject to permissions and target-process restrictions. |
| System memory pressure | linux.sys_stats |
Do MemAvailable, Cached, ZRAM, vmstat, and PSI indicate reclaim activity or memory pressure? |
| Native allocation call stacks | android.heapprofd |
Which malloc/new call stacks contributed allocations, and which allocations remain unreleased? |
| Java object retention relationships | android.java_hprof, MAT, Android Studio Profiler |
Which Java objects are still held, and by whom? |
By default, heapprofd accounts for the bytes the target process requests from allocators such as libc malloc/free and new/delete. This is not RSS, and it does not cover all native backing memory.
GraphicBuffer, dma-buf, GPU textures, driver-side allocations, direct mmap/memfd/ashmem allocations, and allocators that bypass libc malloc are outside the default malloc accounting. For malloc-backed arenas, you may see only the large arena allocation, not the objects inside it. To include a custom allocator, use heapprofd’s custom allocator API (AHeapProfile_registerHeap and related APIs, Android 10+; this requires linking the client library and changing the allocation path), then name the custom heap in heapprofd_config.heaps. This requires dedicated integration work; it is not a default capability. For graphics memory, start with meminfo Graphics/GL, dmabuf, GPU/graphics counters, and SurfaceFlinger / BufferQueue relationships.
heapprofd only adds malloc/new evidence along app/HWUI/Skia/JNI paths.
Use this table to choose the next step:
| Symptom | Preferred tools | Role of heapprofd |
|---|---|---|
| Java heap grows, with clear object retention | HPROF / MAT / Android Studio | Not the first entry point |
| Native Heap / malloc wrappers grow | heapprofd | Locate malloc/new call stacks |
| Graphics / GL / dmabuf / Surface buffers grow | meminfo, dmabuf, GPU/graphics, SurfaceFlinger | Only check whether app/native wrappers are also allocating |
| RSS/PSS grows but heapprofd values remain low | smaps_rollup, maps, mmap/syscall, dmabuf/graphics | Separate the accounting categories first; do not immediately conclude that the heapprofd capture is wrong |
| RSS grows but PSS does not | smaps / file mappings / allocator caches | Do not conclude that there is a leak yet |
Allocator thread caches, fragmentation, ZRAM, and page granularity can all cause RSS and heapprofd to disagree. When RSS is high but heapprofd values are low, consider these boundaries before assuming a capture failure.
The reverse also holds: high cumulative allocations on a call stack in heapprofd do not mean the process’s RSS will rise by the same amount. This may be allocation churn: memory is allocated frequently and freed quickly, producing a high Total malloc size but a low Unreleased malloc size. First distinguish memory that remains held from repeated creation of temporary objects.
If you suspect large mmap allocations or allocations outside the native heap, investigate smaps Private_Dirty/Rss/Pss, maps regions, Android 14+ syscalls sys_mmap/sys_munmap/sys_madvise, or mmap syscall call stacks from perf/simpleperf. Use heapprofd only to check whether malloc wrappers also contribute.
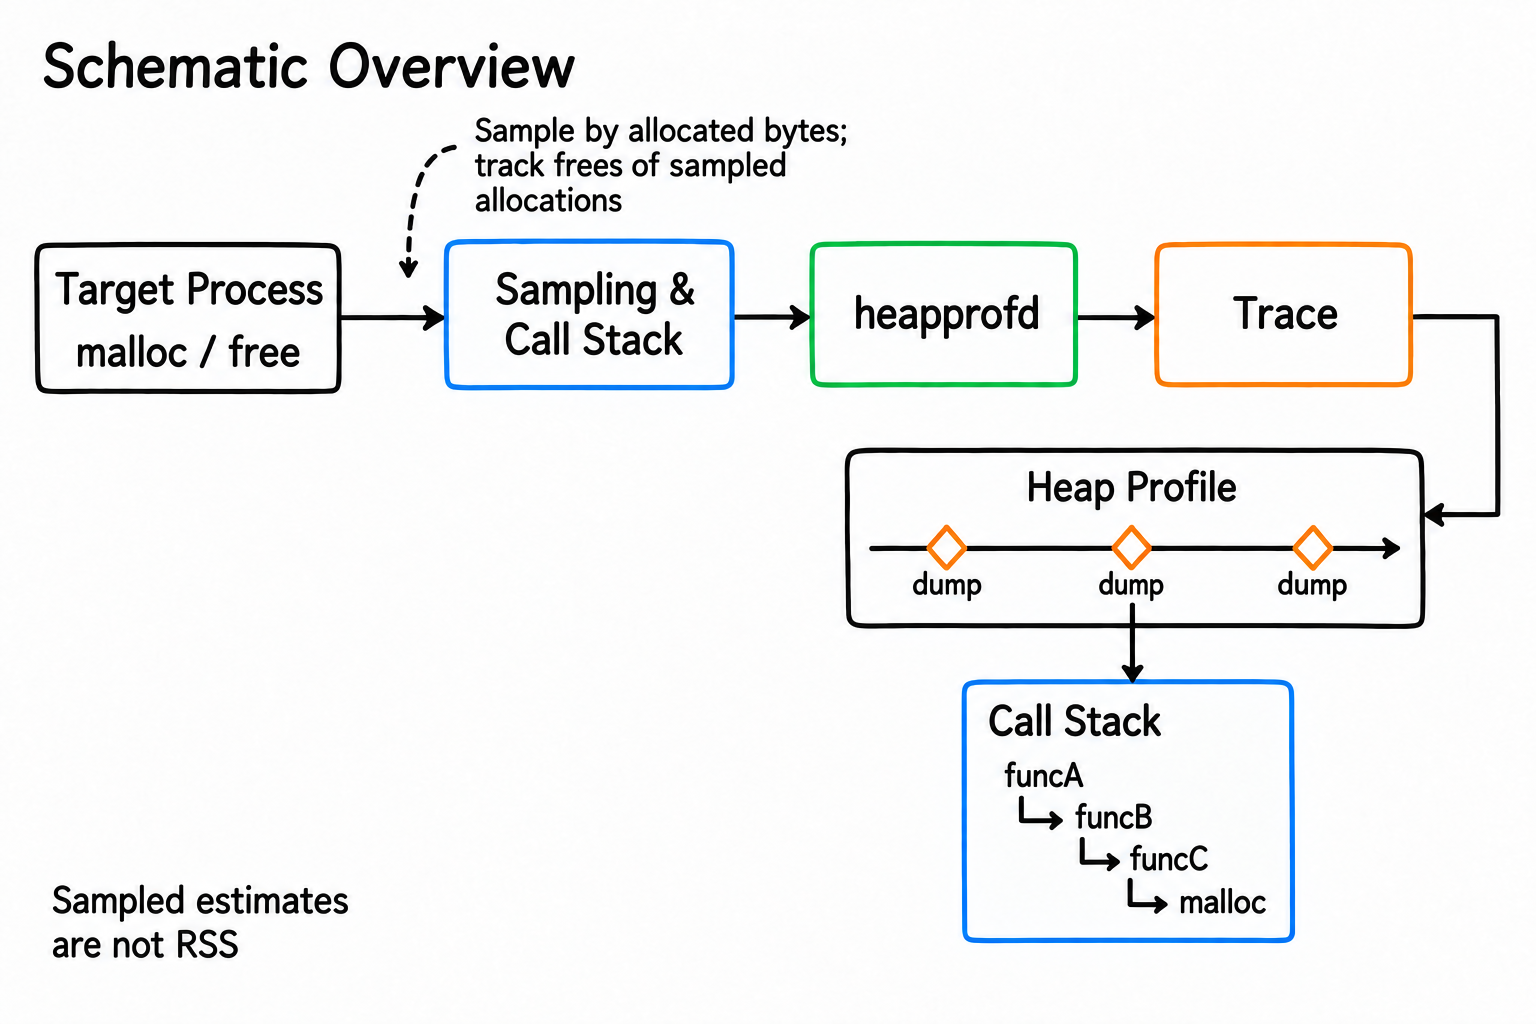
Conceptual diagram: heapprofd samples native allocations and records call stacks; a Heap Profile is not an RSS ledger.
When to Use heapprofd
When a Java heap dump cannot explain the growth, first identify which memory category is growing. Proceed to heapprofd only when the native heap or native wrappers are clearly suspect.
heapprofd is suitable for these problems:
- Native Heap / malloc wrappers keep growing, but a Java heap dump shows no obvious object retention.
- Bitmap, Skia, media-player buffers, or JNI/C++ modules may be holding native backing memory allocated through libc malloc/new.
- Abnormal malloc/new behavior in C++ modules, native services, or daemons.
- Checking whether unreleased allocations increase after a particular application operation.
- Correlating memory growth with thread execution, Binder, and application Track Events.
These problems should not start with heapprofd:
- You only need Java object reference relationships. Use a Java heap dump.
- You want an exact ledger of every small allocation. heapprofd is a sampling profiler by default.
- The target app on a user build is neither
debuggablenorprofileable. Such processes generally cannot be profiled by the shell. - GraphicBuffer, dma-buf, GPU driver memory, or Surface buffer counts are rising. Start with evidence from meminfo Graphics/GL, dmabuf, GPU/graphics, and SurfaceFlinger; use heapprofd only to rule out or locate malloc/new wrapper allocations.
Target eligibility also needs separate consideration. User builds primarily support debuggable/profileable Java apps; userdebug/eng builds can profile most apps and system services, but some critical services may be prohibited by SELinux policies such as never_profile_heap. System processes are not unlocked through <profileable>.
Capture a Native Heap Profile Quickly
The official recommendation is to start with the tools/heap_profile script. It handles many device-side details and works well for quickly investigating a single process.
This command captures by process name for 15 seconds, with a sampling interval of 4096 bytes and a continuous dump every 5 seconds:
1 | tools/heap_profile android \ |
The output directory contains raw-trace and converted profile files. Drag raw-trace into Perfetto UI to see Heap Profile diamonds.
Capturing by process name differs significantly from capturing by PID. -n com.example.app matches an already-running process with that name and also waits for newly launched processes; heapprofd can attach early as the target specializes from zygote into an app process. For a multiprocess app, specify multiple -n / process_cmdline entries, such as com.example.app, com.example.app:remote, and com.example.app:player; otherwise malloc allocations in remote/native child processes will not enter the profile. PID-based capture is better suited to a process already running steadily, but misses early startup allocations. The official documentation also warns that even name-based capture may miss the earliest allocations during zygote specialization.
To capture an app through adb / shell on a user build, allow shell profiling in its manifest:
1 | <application ...> |
This only grants local shell profiling access. It does not mean that arbitrary user processes can be profiled remotely in production.
Starting with Android 15 (API 35), apps can request a heap profile through ProfilingManager. Android 16’s Profiling module targets field profiling on public devices, but results are redacted, contain only information related to the requesting process, and are subject to system rate limits; not every request is guaranteed to be fulfilled. Design this production path separately from the laboratory adb/profileable path.
Capture It Alongside a System Trace
The script is useful for quick investigation, while a handwritten TraceConfig lets you combine heapprofd with system data sources. Start with the minimum heapprofd settings: android.heapprofd, process_cmdline, the sampling interval, continuous dumps, shared memory, and the blocking policy.
System context is optional enrichment: process_stats provides RSS/PSS trends, sys_stats shows system memory pressure, ftrace correlates threads and time windows, and track_event connects application operations. In allocation-heavy scenarios, combining heapprofd and ftrace increases perturbation. A heap+system-context preset should be limited to short laboratory reproductions, with ftrace/heapprofd stats recorded and a check of whether profiling changed the scenario’s duration.
1 | duration_ms: 15000 |
This is still a native heap template, not a graphics memory template. For GraphicBuffer, dma-buf, GPU textures, and Surface buffers, additionally compare dmabuf data, GPU/graphics counters, dumpsys meminfo Graphics/GL, and SurfaceFlinger layer / buffer information. heapprofd can only establish whether malloc/new contributes corresponding allocations.
When the heapprofd buffer uses DISCARD, it must be large enough. Heap profiles often write data in bursts at dump points. Once a DISCARD buffer fills, new data is dropped, putting the final diamond and the largest unreleased allocations at particular risk. After capture, check traced_buf_chunks_discarded and heapprofd_* stats. For long traces or uncertain write volumes, give heapprofd its own large buffer; switch to RING if necessary, and state in the report that older dumps may have been overwritten.
For ad hoc investigation, piping the PBTX directly into perfetto through stdin is the most reliable approach. Place the Android output under /data/misc/perfetto-traces/:
1 | adb push config.pbtx /data/local/tmp/config.pbtx |
A handwritten HeapprofdConfig does not have exactly the same defaults as tools/heap_profile. block_client can block the target process when heapprofd shared memory fills, trading application progress for data completeness. The script enables --block-client by default, but a handwritten configuration requires an explicit decision.
For a laboratory leak reproduction, you can set block_client: true with block_client_timeout_us, accepting blocking on the target process’s malloc path for more complete data. Do not enable it by default for interaction performance analysis, because it can itself affect jank/latency. Interactive scenarios normally use block_client: false, then accept the risk of incompleteness through a larger sampling interval, more shmem_size_bytes, and stats checks. You must check heapprofd_buffer_overran, heapprofd_non_finalized_profile, and whether heapprofd_last_profile_timestamp covers the target window.
When adding heapprofd to a system trace, retain a small set of application markers as well. In-app android.os.Trace / AndroidX Trace events go through atrace; Perfetto SDK Track Events require the track_event data source to be enabled separately.
A media-player scenario, for example, should have at least four marker categories: operation_start, steady_state, operation_end, and release_done/gc_idle_done. Without a release marker, the conclusion can only be “retained allocations increased after the operation,” not “a leak.” The official documentation lists android.log support for userdebug. A rooted user build may also capture it if logd/SELinux permissions allow, but adb root alone does not establish support on every device. On ordinary production user builds, do not assume this configuration captures logcat evidence by default.
Reading Heap Profiles in the UI
After importing the trace, find the Heap Profile track under the target process. Each diamond on the track represents a dump. Clicking a diamond opens a flamegraph in the bottom panel.
Each continuous-dump diamond represents cumulative results from the start of recording up to that point. First inspect unreleased bytes to identify memory that remains held, then total allocations to identify churn. Read the profile in this order:
- Check whether
Unreleased malloc sizekeeps rising across consecutive diamonds. - Check
Total malloc sizeto see whether allocation churn is high but frees are also prompt. - Use the Left Heavy view to find the largest call stacks.
- Locate the first app, SDK, or application-domain frame above the allocator / ART glue.
- Return to the timeline and correlate the triggering operation, application Track Events, and thread execution.
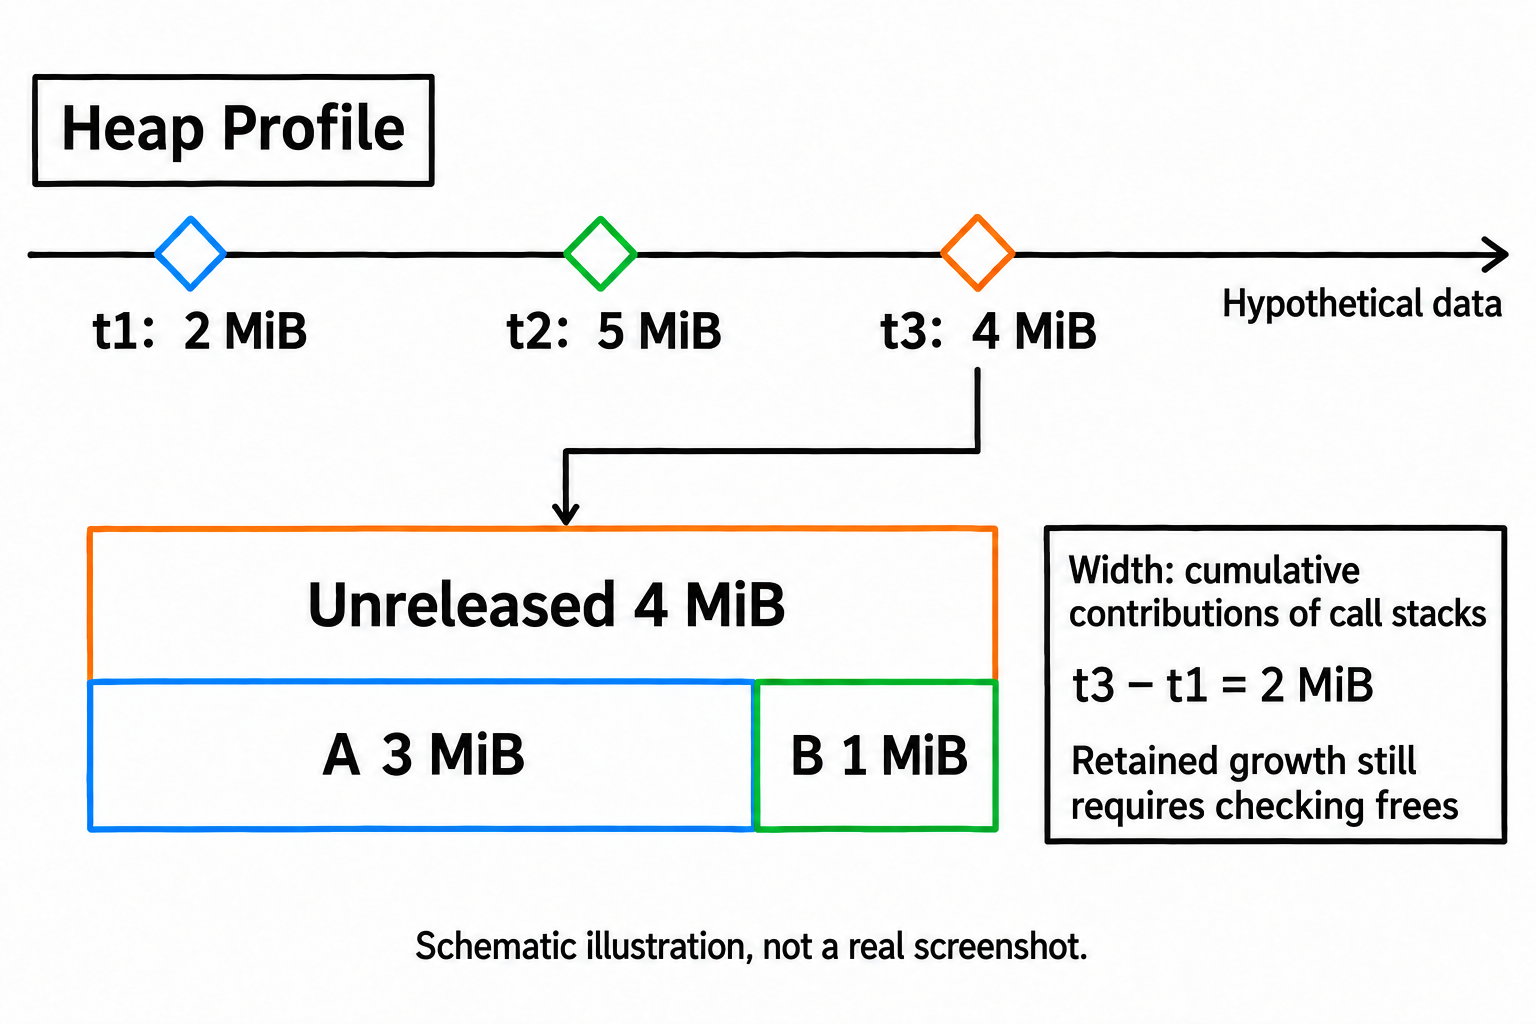
Illustration with hypothetical data: unreleased bytes across consecutive dumps are 2→5→4 MiB. The flamegraph shows call-stack contributions; a single point cannot establish a leak.
Do not diagnose a leak from one diamond. At minimum, compare points before the operation, after the operation, and after cleanup. If memory rises after the operation and still does not fall after cleanup, inspect the unreleased call stacks.
In the laboratory, adb shell killall -USR1 heapprofd can trigger an additional snapshot. Triggering one before entering a screen, one after the screen stabilizes, and one after leaving it and completing release/close/destruction often makes it easier to align application operations with diamonds than relying only on a fixed 5-second interval.
Include “waiting for idle, finalizers, and GC to complete” in this state point only when the native backing is owned by a Java wrapper, NativeAllocationRegistry, or a Cleaner/finalizer. Allocator caches and fragmentation can also mean that heapprofd values fall while RSS does not fall immediately. “Cache” is not a euphemism for “never freed”: there must be a capacity limit, evidence of hits/reuse, and a reclamation policy on exit or under pressure. Otherwise, describe it only as suspected long-term retention.
Querying Unreleased Allocations with SQL
heapprofd writes to these call-stack-related tables:
| Table | Meaning |
|---|---|
heap_profile_allocation |
Allocation/free samples and sizes |
stack_profile_callsite |
Call-stack nodes |
stack_profile_frame |
Function frames |
stack_profile_mapping |
so, apk, jar, and binary mappings |
stack_profile_symbol |
Offline symbolization results |
For a quick view of a single-target profile, start with the official standard library’s summary tree. It aggregates entire call stacks along stack_profile_callsite.parent_id, producing results closer to the flamegraph’s cumulative view:
1 | INCLUDE PERFETTO MODULE android.memory.heap_profile.summary_tree; |
The summary tree aggregates records across all processes, heaps, and times in the trace. This example is only suitable for inspecting the final cumulative state when capturing a single process’s native heap; it is not a snapshot of an arbitrary diamond. It has no process column, so do not directly use it for multiprocess regression statistics. For multiprocess apps, :remote processes, or restarts of identically named processes, return to the raw tables and filter by upid, PID, process name, and diamond timestamp to avoid attributing another process’s allocations to the target.
For a rough inspection by process, diamond timestamp, and leaf frame, return to the raw tables. This SQL computes retained bytes through the end of the final dump. The key is SUM(a.size): allocations are positive and frees are negative, so the sum more closely matches that diamond’s Unreleased malloc size. This is not final attribution; the final report must return to the complete call stack. heap_profile_allocation stores each dump’s delta relative to the previous dump, not a complete snapshot at every dump; you must accumulate ts <= dump_ts. The following query counts only libc.malloc, avoiding the misclassification of com.android.art, which does not record frees, as unreleased native memory.
1 | WITH target_process AS ( |
SQL helps you quickly find the largest contributors. Raw-table queries split call stacks into frame rows and can leave you looking only at leaf frames such as malloc and realloc; the summary tree and UI flamegraph are better for reading full attribution. Before writing a stable script, run PRAGMA table_info(heap_profile_allocation); to confirm the fields and avoid queries breaking across Perfetto versions.
A dump with no change in allocations may contain no new allocation rows. Therefore, select the dump using heap_profile.ts_end, then accumulate the allocation table. With older Trace Processor versions, first confirm the heap_profile schema. If that table is absent, confirm the dump time in the UI; do not fall back to the allocation table’s MAX(ts) and pretend it proves that the final dump succeeded. Also check heapprofd stats. Summation cannot recover historical deltas that have been overwritten.
Leak assessment requires a three-point comparison: before the operation, after the operation, and after release. The following is a report-query skeleton; baseline_dump_ts, after_action_dump_ts, and after_release_dump_ts can come from heap dumps nearest to application markers:
1 | WITH target_process AS ( |
First confirm that all three timestamps correspond to successfully completed dumps of the target heap. Do not use the placeholder timestamps directly. This example returns results only when all three dumps exist. If a dump is missing, the caller should report unavailable data; CASE ... ELSE 0 must not turn missing capture into apparent release. The 1 MiB threshold is only an illustrative filter.
Retention after release is more suggestive of a leak. Growth during an operation that falls back after release is a peak. Long-term retention can be described as a cache only if it has a capacity limit, evidence of reuse, and a reclamation policy under pressure.
A report can use this fixed set of fields:
1 | trace_name,process_name,upid,pid,scenario,dump_phase,dump_ts_ms,sampling_interval_bytes,dump_interval_ms,top_stack_frame,mapping_name,unreleased_mb,retained_delta_mb,total_malloc_mb,allocation_count,symbol_status,profileable_state,data_loss_status,evidence_grade,conclusion_type,next_action |
Understanding the Sampling Interval
heapprofd does not record every allocation by default. sampling_interval_bytes: 4096 means that it samples once per 4096 allocated bytes on average, then attributes allocations to call stacks using sampling probabilities. Sufficiently large allocations may be recorded at their actual size, but do not interpret the sampling interval as a hard boundary where everything below it is estimated and everything above it is exact. Android versions and heap configurations also affect actual behavior.
How to choose an interval:
- 4096 bytes is a common starting point, suitable for most local analysis.
- If you suspect large numbers of small native allocations, reduce the interval, at the cost of greater overhead.
- If a high allocation rate causes buffer overruns, first increase shared memory or increase the sampling interval.
- A handwritten
HeapprofdConfigmust explicitly set a nonzero sampling interval. Setting it to 1 approaches exact capture but has high overhead. Zero is invalid and, before Android 12, could even crash the target process.
Do not describe sampled results as “exactly 12.34 MB was allocated.” A better formulation is: “At a 4096-byte sampling interval, unreleased allocations were concentrated in call stacks A/B/C, with A contributing the largest share.” A sampling profiler helps establish direction and ranking; it does not replace allocator accounting.
Top-stack rankings become unstable with dense small-object allocations, few samples, short windows, or allocations spread across many call stacks. Before/after comparisons must use the same sampling interval, comparable workloads, and the same target window. Do not compare small differences such as 1% or 2% unless they reproduce across multiple runs. You can assign evidence_grade as follows: sufficient samples, consistent trends across continuous dumps, and complete symbols qualify as strong; data loss, an incomplete profile, unknown symbols, few samples, or only one reproduction make the evidence weak. For weak evidence, say “candidate call stack,” not “root-cause call stack.”
Java Heap Dumps and Java Allocation Sampling
This section supplements the memory accounting categories introduced earlier. heapprofd can inspect native malloc/new and, on Android 12 or later, switch to Java allocation sampling, but it still does not replace a Java heap dump.
| Capability | Output | Suitable questions |
|---|---|---|
| heapprofd native profiling | malloc/new call stacks | Who allocated native memory? |
| Java heap dump | Object retention graph | Who holds Java objects? |
| Java allocation sampling | Call stacks that create Java objects | Which code generates heavy Java allocation churn? |
Enable Java allocation sampling through heapprofd with heaps: "com.android.art", or use the script argument --heaps com.android.art. It requires Android 12 or later. It records call stacks at object creation, not when objects are garbage-collected, and is not equivalent to the retention relationships in a Java heap dump.
Symbolization and Confidence
If the flamegraph contains only addresses, unknown, or obfuscated Java/Kotlin names, address symbolization and deobfuscation first. The official recommendation is to run traceconv bundle on the collected trace to produce an archive containing symbol information, then supply native symbols and ProGuard/R8 mappings as described in the symbolization documentation.
Record the APK/build ID, native-symbol version, and ProGuard/R8 mapping version in the report. A Build ID mismatch reduces the evidence to address-level observations. When a third-party SDK or stripped so leaves only addresses, the next step is to obtain the matching build’s unstripped symbols / mapping, not to immediately change application code.
Do not blindly filter out libart.so, allocator glue, or system libraries while reading stacks. ART frames can provide essential context for Java-to-native calls, NativeAllocationRegistry, or object creation paths.
First find the first app, SDK, or application-domain frame above allocator/ART glue. Filter a class of frames only after confirming that they are merely repetitive glue. Treat DEDUPED, function folding caused by ICF, Build ID mismatches, and single-frame stacks as symbolization issues first.
Also assess unwinding confidence: the share of unknown frames, the share of single-frame stacks, Build ID matching, Java-frame availability, and known issues for the target ABI / Android version. Missing symbols affect attribution confidence. Distinguish “symbolized and attributable” from “localized only to an so / allocator glue” in the report.
At minimum, document:
- Whether the target process is profileable/debuggable.
sampling_interval_bytesand the continuous-dump interval.- Whether
statsrecords heapprofd buffer overruns, client errors, incomplete profiles,heapprofd_unwind_time_us,heapprofd_client_spinlock_blocked,heapprofd_sampling_interval_adjusted, or data loss.
When data loss or heapprofd buffer overruns occur, do not present the numbers as an exact ledger. Prefer wording such as “This call stack is a major contributor to unreleased allocations under the following sampling conditions.”
For the general trace health check (buffer/ftrace loss), use the stats query from article 12; run a separate heapprofd health check. heapprofd_buffer_overran, heapprofd_client_error, and heapprofd_hit_guardrail already exist in v57.2/v58.2. Most are indexed stats whose records are generated on demand. Seeing only two single-value entries in a trace without a heap profile does not imply that the other entries are exclusive to newer versions.
Before interpreting the exception query below, establish that a profile or dump for the target process/heap exists, covers the window, and has completed. With no profile, report profile_unavailable, not “all clean.” Even when a profile exists, an empty exception query only means these exceptions were not recorded. heapprofd_unwind_time_us, heapprofd_client_spinlock_blocked, and heapprofd_sampling_interval_adjusted provide overhead/sampling context; they should not all be treated as failures in the same way as nonzero error/data_loss entries.
heapprofd_last_profile_timestamp is a supporting timestamp for the last profile packet. It cannot replace heap_profile.ts_end, diamonds, and final completion status as proof that the target window is complete. The following query retains this context for review:
1 | SELECT name, idx, severity, source, value |
Checks Before Publishing a Report
Capture conditions:
- heapprofd requires Android 10 or later; Java allocation sampling requires Android 12 or later.
- Capturing a target app through adb / shell on a user build generally requires
debuggableor<profileable android:shell="true"/>. - Capturing a running process by PID may miss early startup allocations; waiting for startup by process name covers more of startup.
- Runtime profiling does not take effect immediately. If the target process is very idle, profiling may not activate until another wave of allocations.
- A target process can be profiled by only one relevant session at a time. If there is a conflict, check for an old
perfettosession first.
Data confidence:
- 32-bit programs have restrictions on some older Android versions. If the profile is empty, consult the official Known Issues for version differences.
- Review heapprofd, stackprofile, and symbolization stats. Downgrade confidence for overruns, non-finalized profiles, and unknown symbols.
- Disagreement between heapprofd numbers and RSS is common. Fragmentation, thread caches, allocator caches, and ZRAM can all contribute.
Conclusion boundaries:
- A high
Total malloc sizedoes not mean a leak. Compare it withUnreleased malloc size, consecutive diamonds, and application-operation timestamps first. - High graphics backing memory does not necessarily produce high heapprofd values. Account for Graphics/GL, dmabuf, GPU, and Surface buffers separately.
- Classify the conclusion as
leak / peak / cache / churn / out-of-scope graphics memory / evidence insufficient, each with a different next action.
Connecting Memory Trends to Call Stacks
heapprofd addresses native allocation call stacks. It replaces neither Java heap dumps nor RSS/PSS trends; it supplies the missing answer to “Who allocated native heap memory managed by libc malloc/new?” GraphicBuffer, dma-buf, GPU textures, and Surface buffers belong to separate graphics memory accounting. heapprofd can only help determine whether app/native wrappers are also creating malloc/new pressure.
In practice, follow this sequence:
- Confirm the memory trend with process stats, meminfo, smaps, or production monitoring.
- If the growth is in Native Heap / malloc wrappers / allocator paths visible to heapprofd, use heapprofd. If only RSS/PSS is rising, first separate the categories using smaps_rollup, meminfo classifications, mmap/syscall data, or dmabuf/graphics evidence.
- Inspect Unreleased malloc size and the flamegraph in the UI.
- Find the largest contributors with SQL, then return to the flamegraph for complete call stacks.
- Complete symbolization and document sampling conditions and confidence.
- Classify the result as a leak, peak, cache, churn, graphics memory outside heapprofd’s scope, or insufficient evidence.
References
- Memory: Callstack-based Allocation Profiling
- Memory: Java heap dumps
- Memory counters and events
- heapprofd design
- TraceConfig reference
- Track Events
- Android Log data source
- ProfilingManager
- Android Profiling module
Source version verified: b23c67be1159e3f0b0657bd97be9e139e0d8ee2c (2026-09-19).
About Me and the Blog
Follow Android Performance.