This is the fourth article in the Perfetto series, explaining how to use trace_processor_shell to open large files exceeding 2GB locally. In actual problem analysis, we often encounter very large Trace files (greater than 2GB) that cannot be opened by directly dragging them into ui.perfetto.dev due to browser memory limitations. In this case, we need to use the trace_processor_shell tool provided by the official to open large files locally.
With Google announcing the deprecation of the Systrace tool and the release of Perfetto, Perfetto has basically replaced Systrace in my daily work. At the same time, major manufacturers like OPPO and Vivo have also switched from Systrace to Perfetto. Many friends who are new to Android performance optimization feel a headache when facing the dazzling interface and complex functions of Perfetto. They hope that I can present those previous Systrace articles using Perfetto.
Table of Contents
- Perfetto Series Catalog
- 0. trace_processor_shell Tool Download
- 1. Using trace_processor_shell to Open Large Trace Files
- 2. Difference Between Command Line Startup and Direct UI Opening
- 3. Mac Permission Issues
- Reference Documents
- About Me && Blog
Paul Graham said: “Either give a lot of people something they kind of want, or give a small number of people something they really want.“ Perfetto is actually something that a small number of people really want, so let’s start writing. I welcome everyone to exchange and communicate. If you find errors or inaccurate descriptions, please inform me in time, and I will modify them in time to avoid misleading others.
This series aims to examine the overall operation of the Android system from a new perspective through the tool Perfetto. In addition, it also aims to provide a different angle to learn key modules such as App, Framework, and Linux. Although you may have read many articles about Android Framework, App, and performance optimization, you may still feel confused because it is difficult to remember the code or understand its running process. Through the graphical tool Perfetto, you may gain a deeper understanding.
Perfetto Series Catalog
- Android Perfetto Series Catalog
- Android Perfetto Series 1: Introduction to Perfetto
- Android Perfetto Series 2: Capturing Perfetto Traces
- Android Perfetto Series 3: Familiarizing with the Perfetto View
- Android Perfetto Series 4: Opening Large Traces via Command Line
- Android Perfetto Series 5: Choreographer-based Rendering Flow
- Android Perfetto Series 6: Why 120Hz? Advantages and Challenges
- Android Perfetto Series 7: MainThread and RenderThread Deep Dive
- Android Perfetto Series 8: Understanding Vsync and Performance Analysis
- Android Perfetto Series 9: Interpreting CPU Information
- Android Perfetto Series 10: Binder Scheduling and Lock Contention
- Video (Bilibili) - Android Perfetto Basics and Case Studies
- Video (Bilibili) - Android Perfetto: Trace Graph Types - AOSP, WebView, Flutter + OEM System Optimization
If you haven’t seen the Systrace series yet, here is the portal:
- Systrace Series Catalog: Systematically introduced the use of Systrace, the predecessor of Perfetto, and used Systrace to learn and understand the basic rules of Android performance optimization and Android system operation.
- Personal Blog: Personal blog, mainly content related to Android, and also put some content related to life and work.
Welcome everyone to join the WeChat group or Planet on the About Me page to discuss your problems, the parts about Perfetto you most want to see, and discuss all Android development related content with group friends.
0. trace_processor_shell Tool Download
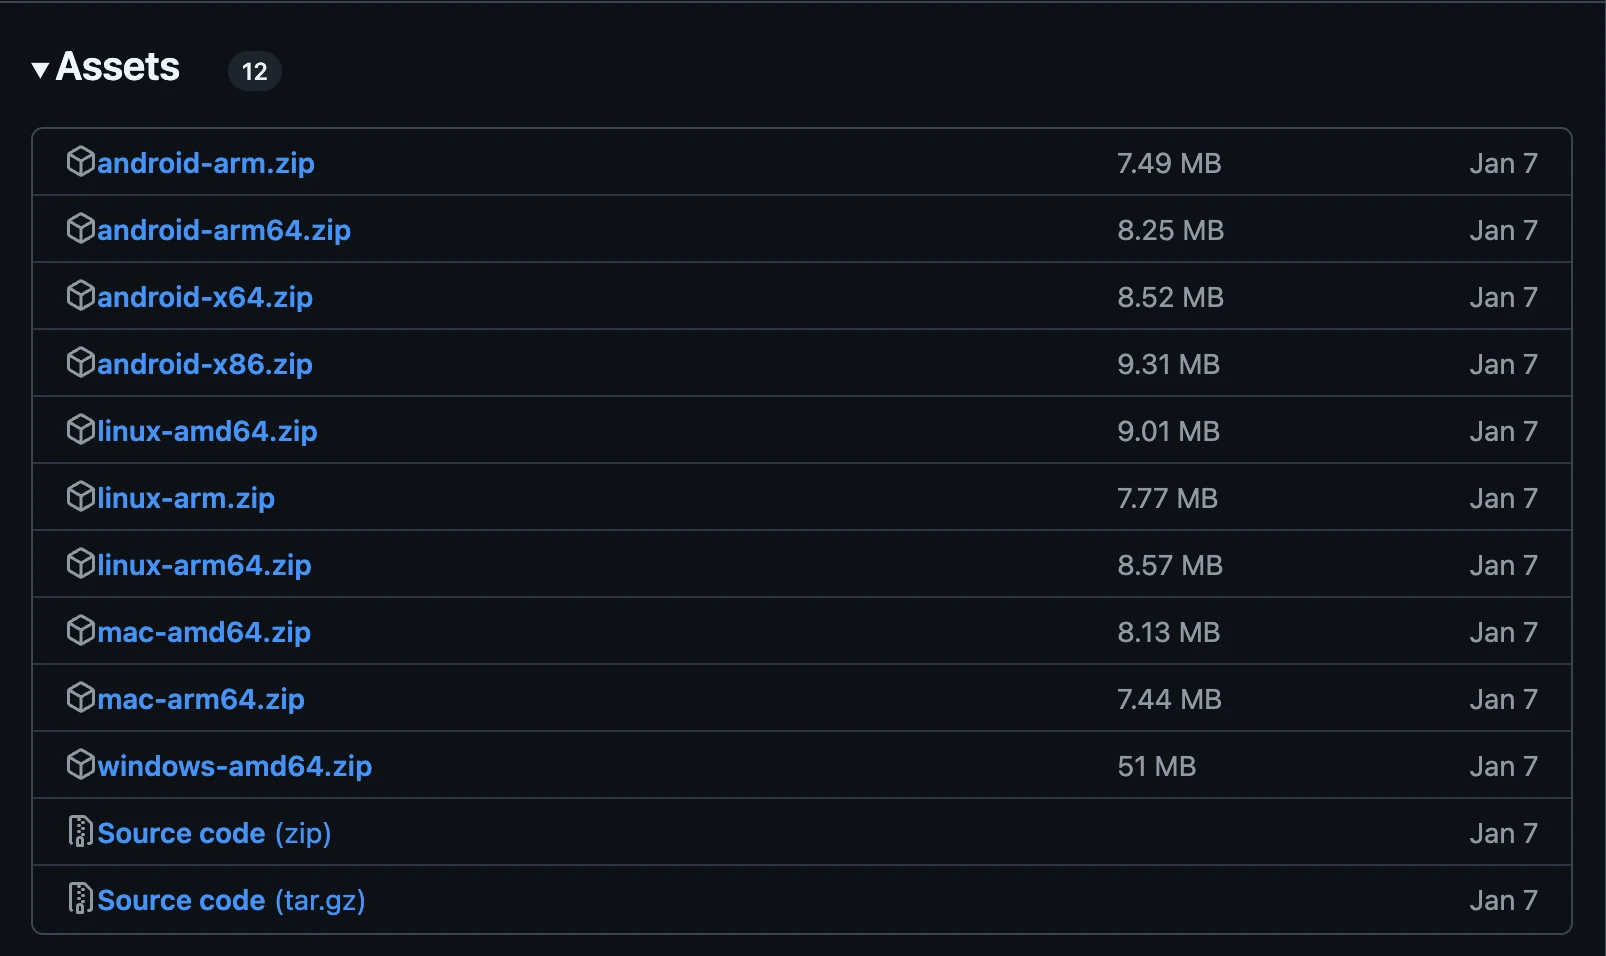
Official download address: https://github.com/google/perfetto/releases , find the latest release version, and choose your own platform to download:
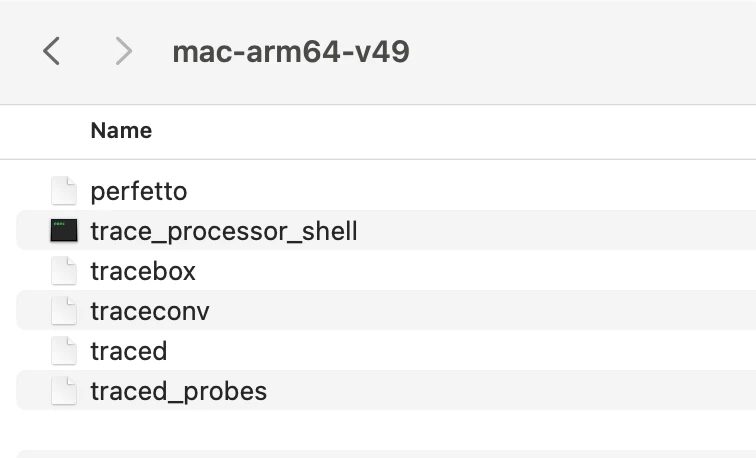
After downloading, there will be the trace_processor_shell tool inside (taking Mac platform as an example)
trace_processor_shell is one of the core tools of the Perfetto open source project, providing high-performance local Trace parsing services. After starting the HTTP server via the –httpd parameter, it allows:
- Local native acceleration: Bypass the performance limitations of the browser WASM and directly call the parsing engine implemented in C++. Based on the parsing engine implemented by Rust/C++ mixing, it optimizes memory layout and parallel processing, and supports flow parsing of ultra-large trace files.
- Interactive analysis: Deeply integrated with Perfetto UI to support dynamic queries and visualization.
- Offline debugging: No need to upload trace to the cloud, protect privacy and support intranet environment.
Other parameters
| Parameter | Function | Example Value |
|---|---|---|
--http-port |
Specify listening port | --httpd :8080 |
--preload |
Preload common data tables | --preload sched |
--num-threads |
Set parsing thread count (default is CPU core count) | --num-threads 8 |
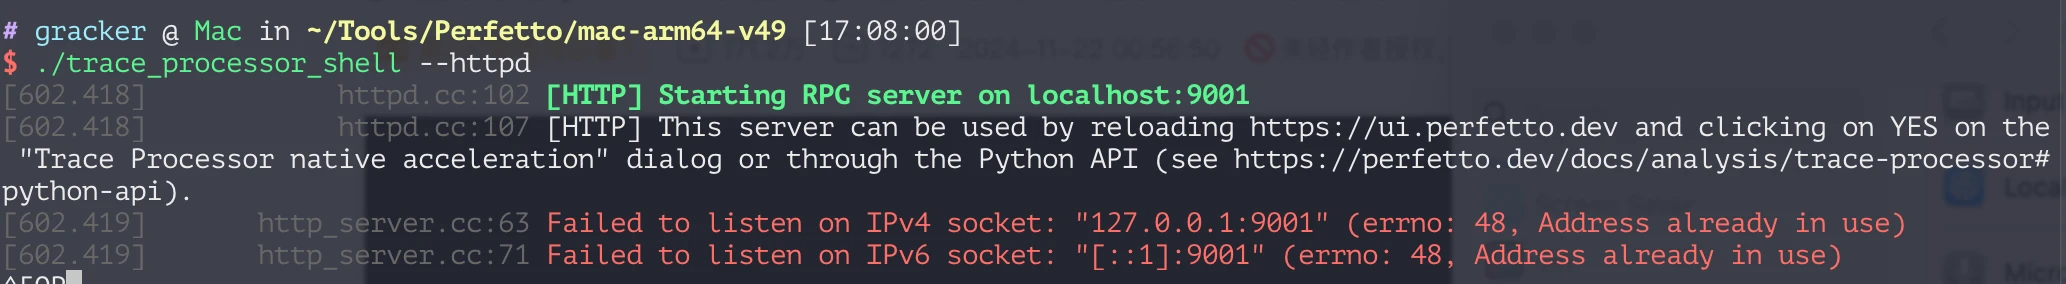
1. Using trace_processor_shell to Open Large Trace Files
1 | ./trace_processor_shell --httpd ../jank-HangLVZongHeng-TrainTicket-ScrollSuperJank.perfetto-trace |
At this time, open https://ui.perfetto.dev on the web page, and there will be the following pop-up box
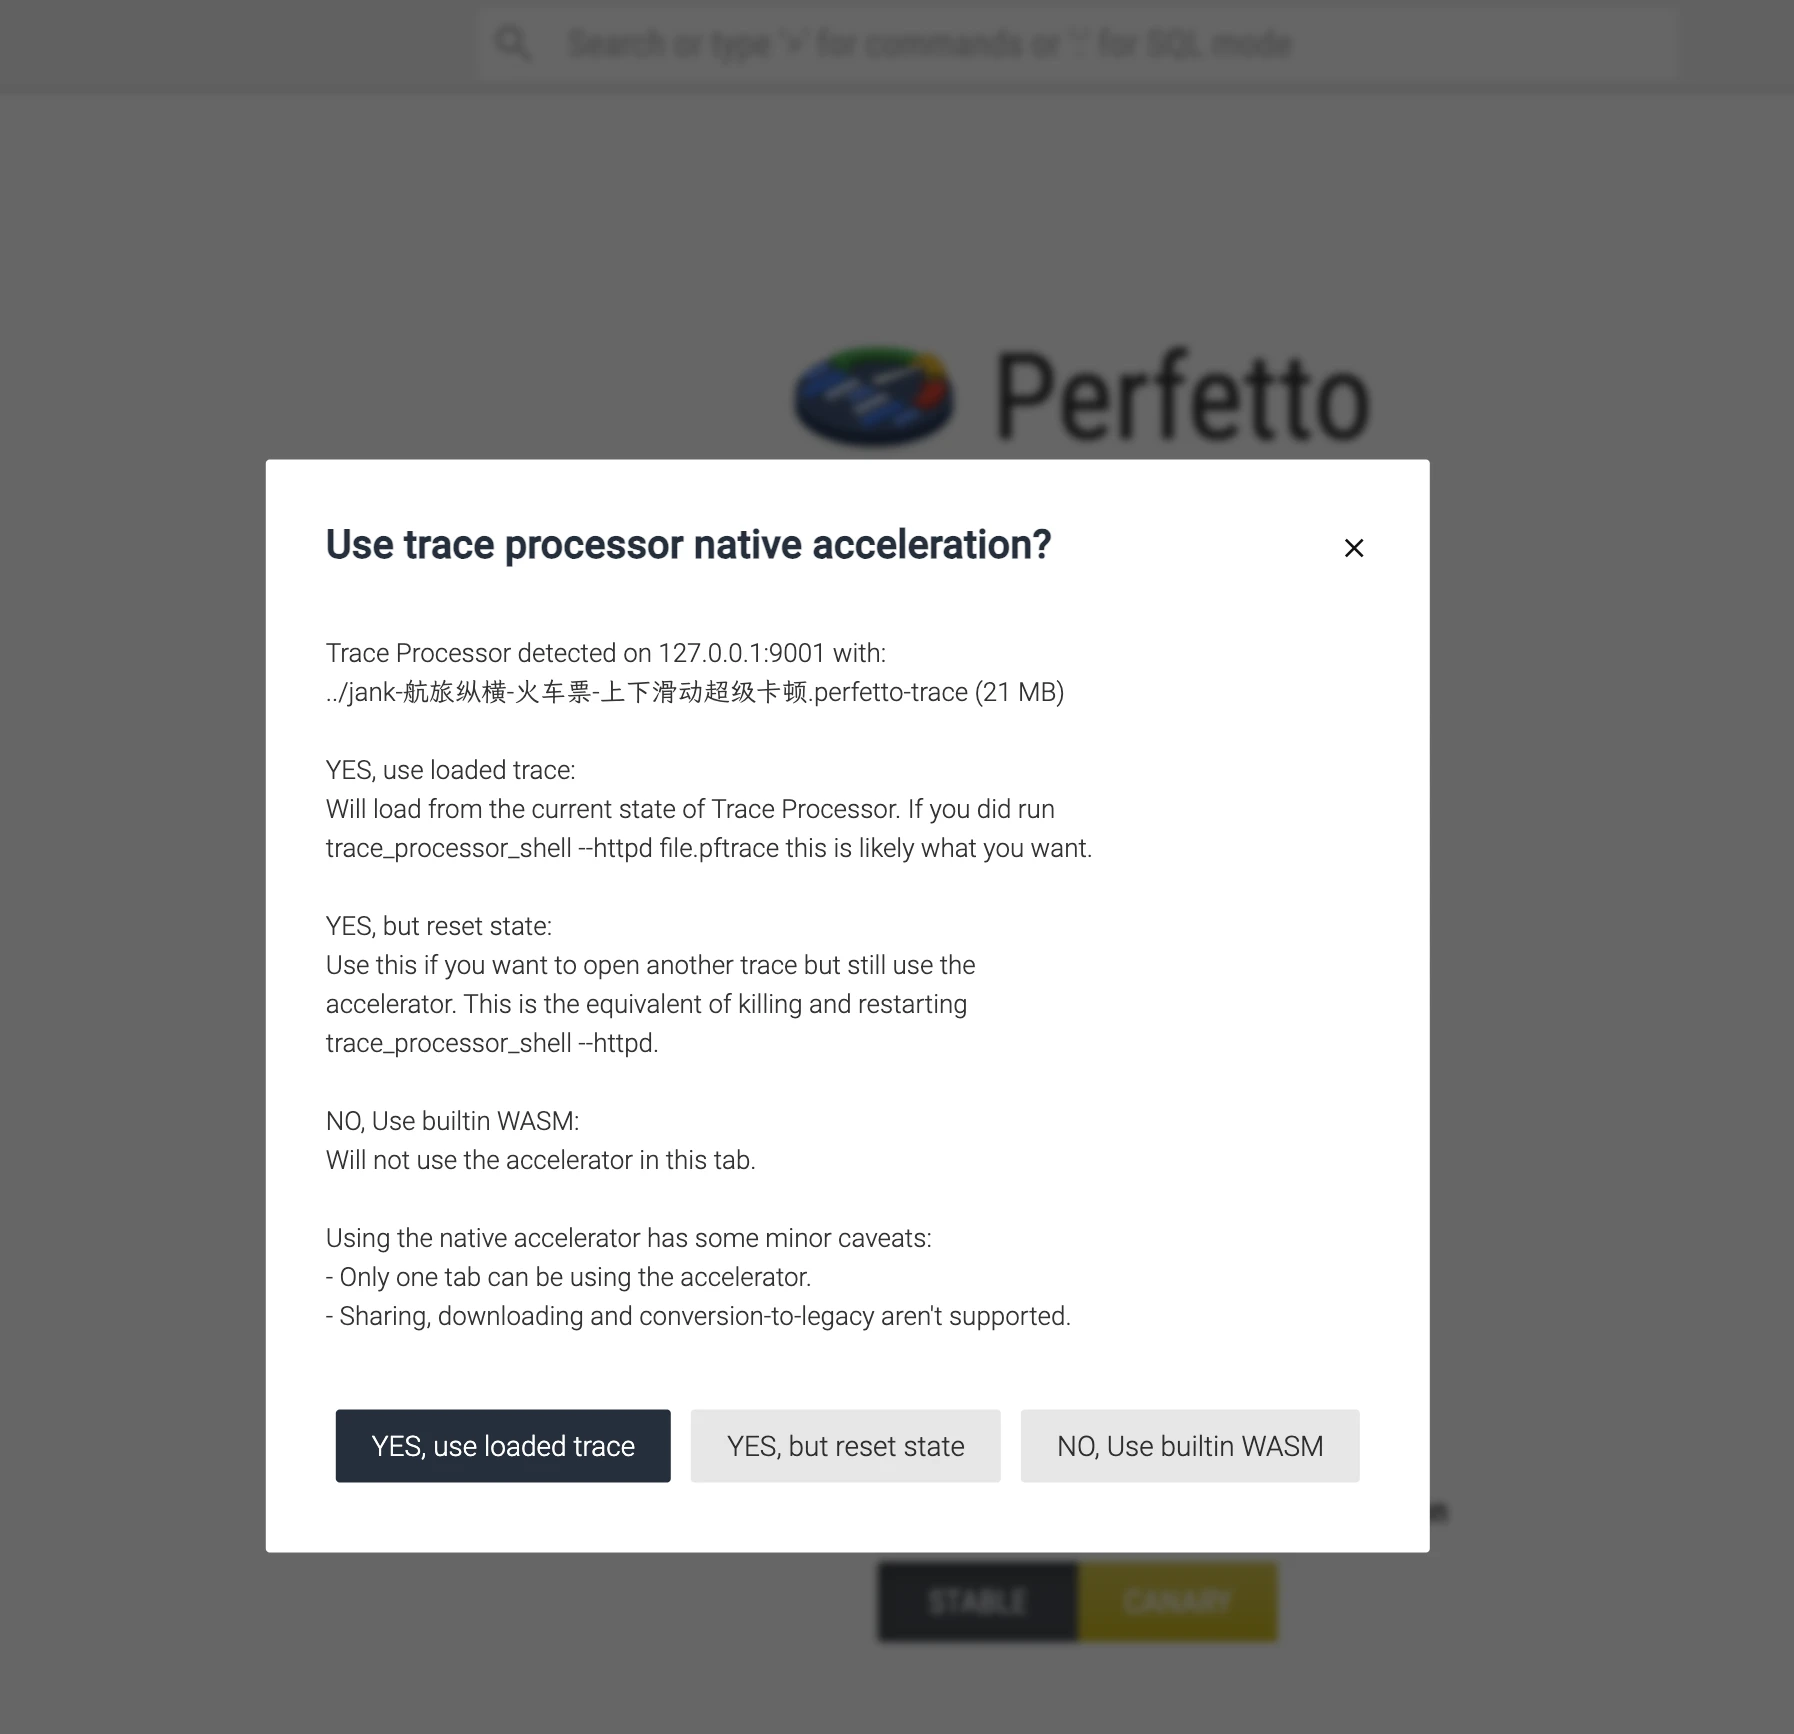
The detailed functions of the pop-up options are as follows
1. YES, use loaded trace
- Function: Directly reuse the trace file state currently loaded by Trace Processor (that is,
../jank-HangLVZongHeng-TrainTicket-ScrollSuperJank.perfetto-tracespecified in the command line). - Applicable Scenario:
If you have already loaded the trace file viatrace_processor_shell --httpdand hope that the UI directly uses the parsing state of the current process (including executed SQL queries, filtering conditions, etc.), choose this option. - Advantage:
Avoid re-parsing files to save time and memory.
2. YES, but reset state
- Function: Force reset the Trace Processor state and reload the current trace file (or load a new file).
- Applicable Scenario:
- Need to clear all states of the current Trace Processor (such as temporary query results, filters, etc.) and start analysis again.
- Want to load another trace file through the same port (need to stop the current process or change the port first).
- Equivalent Operation:
Equivalent to closing the currenttrace_processor_shellprocess and re-executing the command.
3. NO, Use builtin WASM
- Function: Completely bypass the local Trace Processor service and use the browser’s built-in WebAssembly (WASM) engine to parse the trace file instead.
- Applicable Scenario:
- The local Trace Processor service is unavailable or has compatibility issues.
- Need to support WASM mode exclusive functions such as sharing links and downloading modified trace files.
- Cost:
Parsing speed of large files (such as >100MB) drops significantly, and may crash due to browser memory limitations.
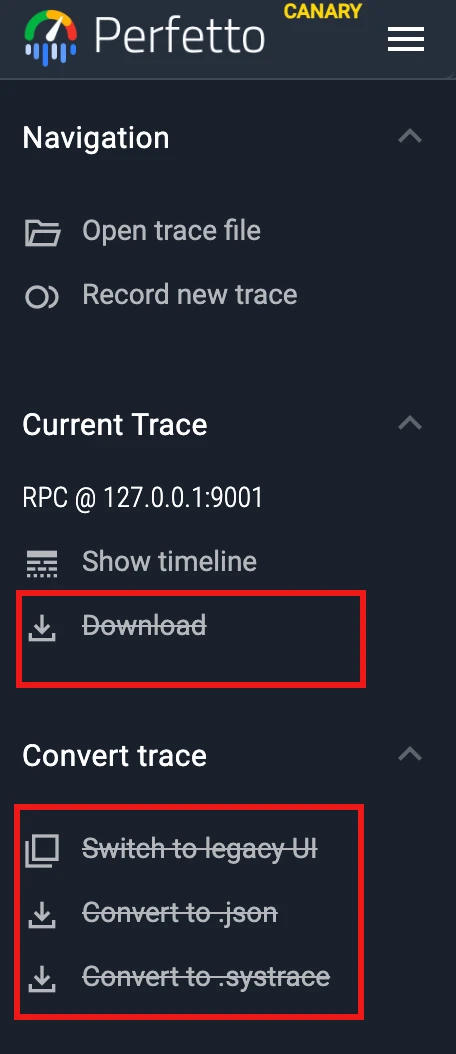
If you choose YES, use loaded trace, after opening Trace, the following functions are unavailable
2. Difference Between Command Line Startup and Direct UI Opening
Startup via Command Line (trace_processor_shell --httpd)
- Core Mechanism:
Start a high-performance C++ Trace Processor service locally (listening on127.0.0.1:9001) to provide native accelerated trace parsing capabilities. - Advantage:
- Performance: Native code parsing speed far exceeds WASM, especially suitable for large trace files (such as >100MB).
- Function Scalability: Support advanced functions such as SQL query and custom metric calculation.
- State Retention: The parsing state of Trace Processor (such as SQL temporary tables) can be retained across page sessions.
- Limitation:
- Cannot directly share trace file links or download modified files via UI.
- Only one browser tab is allowed to use the acceleration service at the same time.
Directly Open UI Web Page (ui.perfetto.dev)
- Core Mechanism:
Completely rely on the browser’s built-in WebAssembly engine to parse trace files, with no local service participation. - Advantage:
- Convenience: No need to install or start local tools, suitable for quickly viewing small traces.
- Function Completeness: Support collaboration functions such as sharing links and downloading modified trace files.
- Disadvantage:
- Performance Bottleneck: WASM parsing speed is slow, and large files may cause the browser to freeze or crash.
- Function Limitation: Does not support some advanced SQL queries and custom analysis functions.
Summary and Suggestions
- Prioritize Command Line Startup: When processing large traces or requiring complex analysis, use
trace_processor_shell --httpdto improve performance. - Temporary Lightweight Analysis: Directly uploading to
ui.perfetto.devis more convenient, but pay attention to file size limits.
3. Mac Permission Issues
Running ./trace_processor_shell --httpd directly on Mac will verify the following error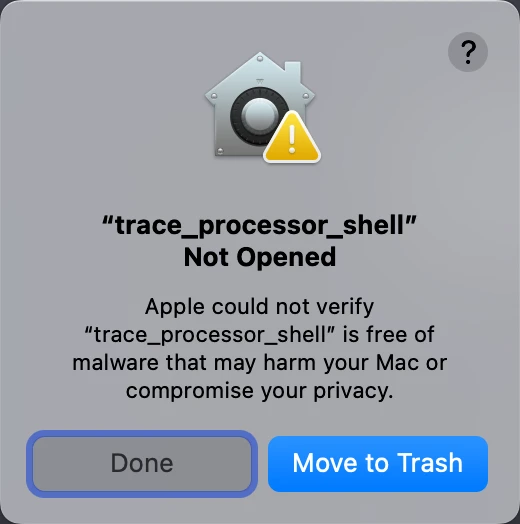
You need to click Allow in Settings - Privacy & Security to continue running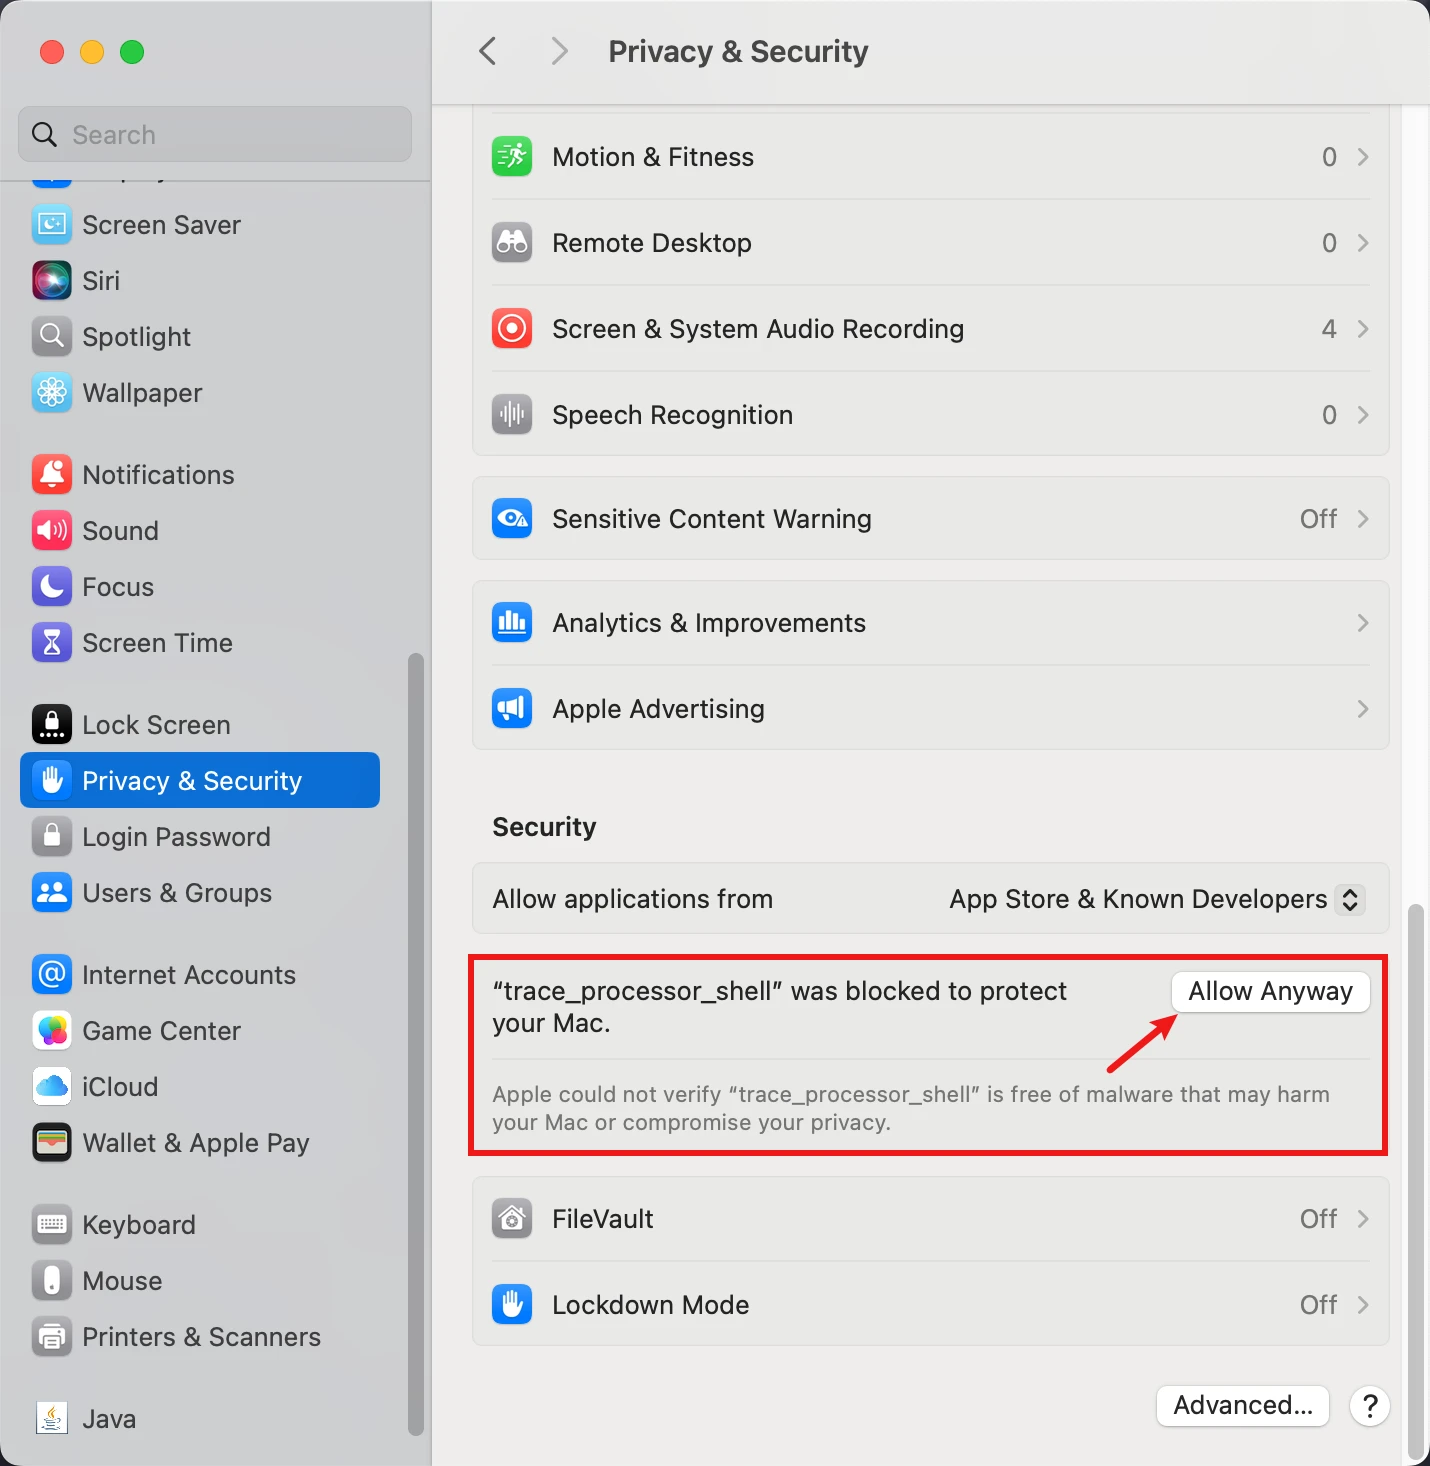
Reference Documents
About Me && Blog
Here is a personal introduction and related links. I hope to communicate more with my peers. When three people walk together, there must be one who can be my teacher!
- Blogger Personal Introduction: Contains personal WeChat and WeChat group links.
- This Blog Content Navigation: A navigation of personal blog content.
- Personal Collection of Excellent Blog Articles - Android Performance Optimization Must-Know: Welcome everyone to recommend themselves and others (WeChat private chat is fine)
- Android Performance Optimization Knowledge Planet: Welcome to join, thank you for your support~
One person can go faster, a group of people can go further