This is the third article in the Perfetto series. The first two articles introduced what Perfetto is and how to capture Perfetto Trace. This article simply introduces how to look at the complex Perfetto information after opening Perfetto Trace on the web side.
With Google announcing the deprecation of the Systrace tool and the release of Perfetto, Perfetto has basically replaced Systrace in my daily work. At the same time, major manufacturers like OPPO and Vivo have also switched from Systrace to Perfetto. Many friends who are new to Android performance optimization feel a headache when facing the dazzling interface and complex functions of Perfetto. They hope that I can present those previous Systrace articles using Perfetto.
Table of Contents
- Perfetto Series Catalog
- Perfetto View Interface
- Perfetto Trace Interface
- Basic Operations
- Perfetto Usage Tips
- Summary
- About Me && Blog
Paul Graham said: “Either give a lot of people something they kind of want, or give a small number of people something they really want.“ Perfetto is actually something that a small number of people really want, so let’s start writing. I welcome everyone to exchange and communicate. If you find errors or inaccurate descriptions, please inform me in time, and I will modify them in time to avoid misleading others.
This series aims to examine the overall operation of the Android system from a new perspective through the tool Perfetto. In addition, it also aims to provide a different angle to learn key modules such as App, Framework, and Linux. Although you may have read many articles about Android Framework, App, and performance optimization, you may still feel confused because it is difficult to remember the code or understand its running process. Through the graphical tool Perfetto, you may gain a deeper understanding.
Perfetto Series Catalog
- Android Perfetto Series Catalog
- Android Perfetto Series 1: Introduction to Perfetto
- Android Perfetto Series 2: Capturing Perfetto Traces
- Android Perfetto Series 3: Familiarizing with the Perfetto View
- Android Perfetto Series 4: Opening Large Traces via Command Line
- Android Perfetto Series 5: Choreographer-based Rendering Flow
- Android Perfetto Series 6: Why 120Hz? Advantages and Challenges
- Android Perfetto Series 7: MainThread and RenderThread Deep Dive
- Android Perfetto Series 8: Understanding Vsync and Performance Analysis
- Android Perfetto Series 9: Interpreting CPU Information
- Android Perfetto Series 10: Binder Scheduling and Lock Contention
- Video (Bilibili) - Android Perfetto Basics and Case Studies
- Video (Bilibili) - Android Perfetto: Trace Graph Types - AOSP, WebView, Flutter + OEM System Optimization
If you haven’t seen the Systrace series yet, here is the portal:
- Systrace Series Catalog: Systematically introduced the use of Systrace, the predecessor of Perfetto, and used Systrace to learn and understand the basic rules of Android performance optimization and Android system operation.
- Personal Blog: Personal blog, mainly content related to Android, and also put some content related to life and work.
Welcome everyone to join the WeChat group or Planet on the About Me page to discuss your problems, the parts about Perfetto you most want to see, and discuss all Android development related content with group friends.
Perfetto View Interface
After capturing the Perfetto Trace, it is generally opened in ui.perfetto.dev (if you use the script provided by the official, it will open automatically on this website after capturing, you can check the source code of the script if you want to see how to implement it). The interface after opening is as follows:
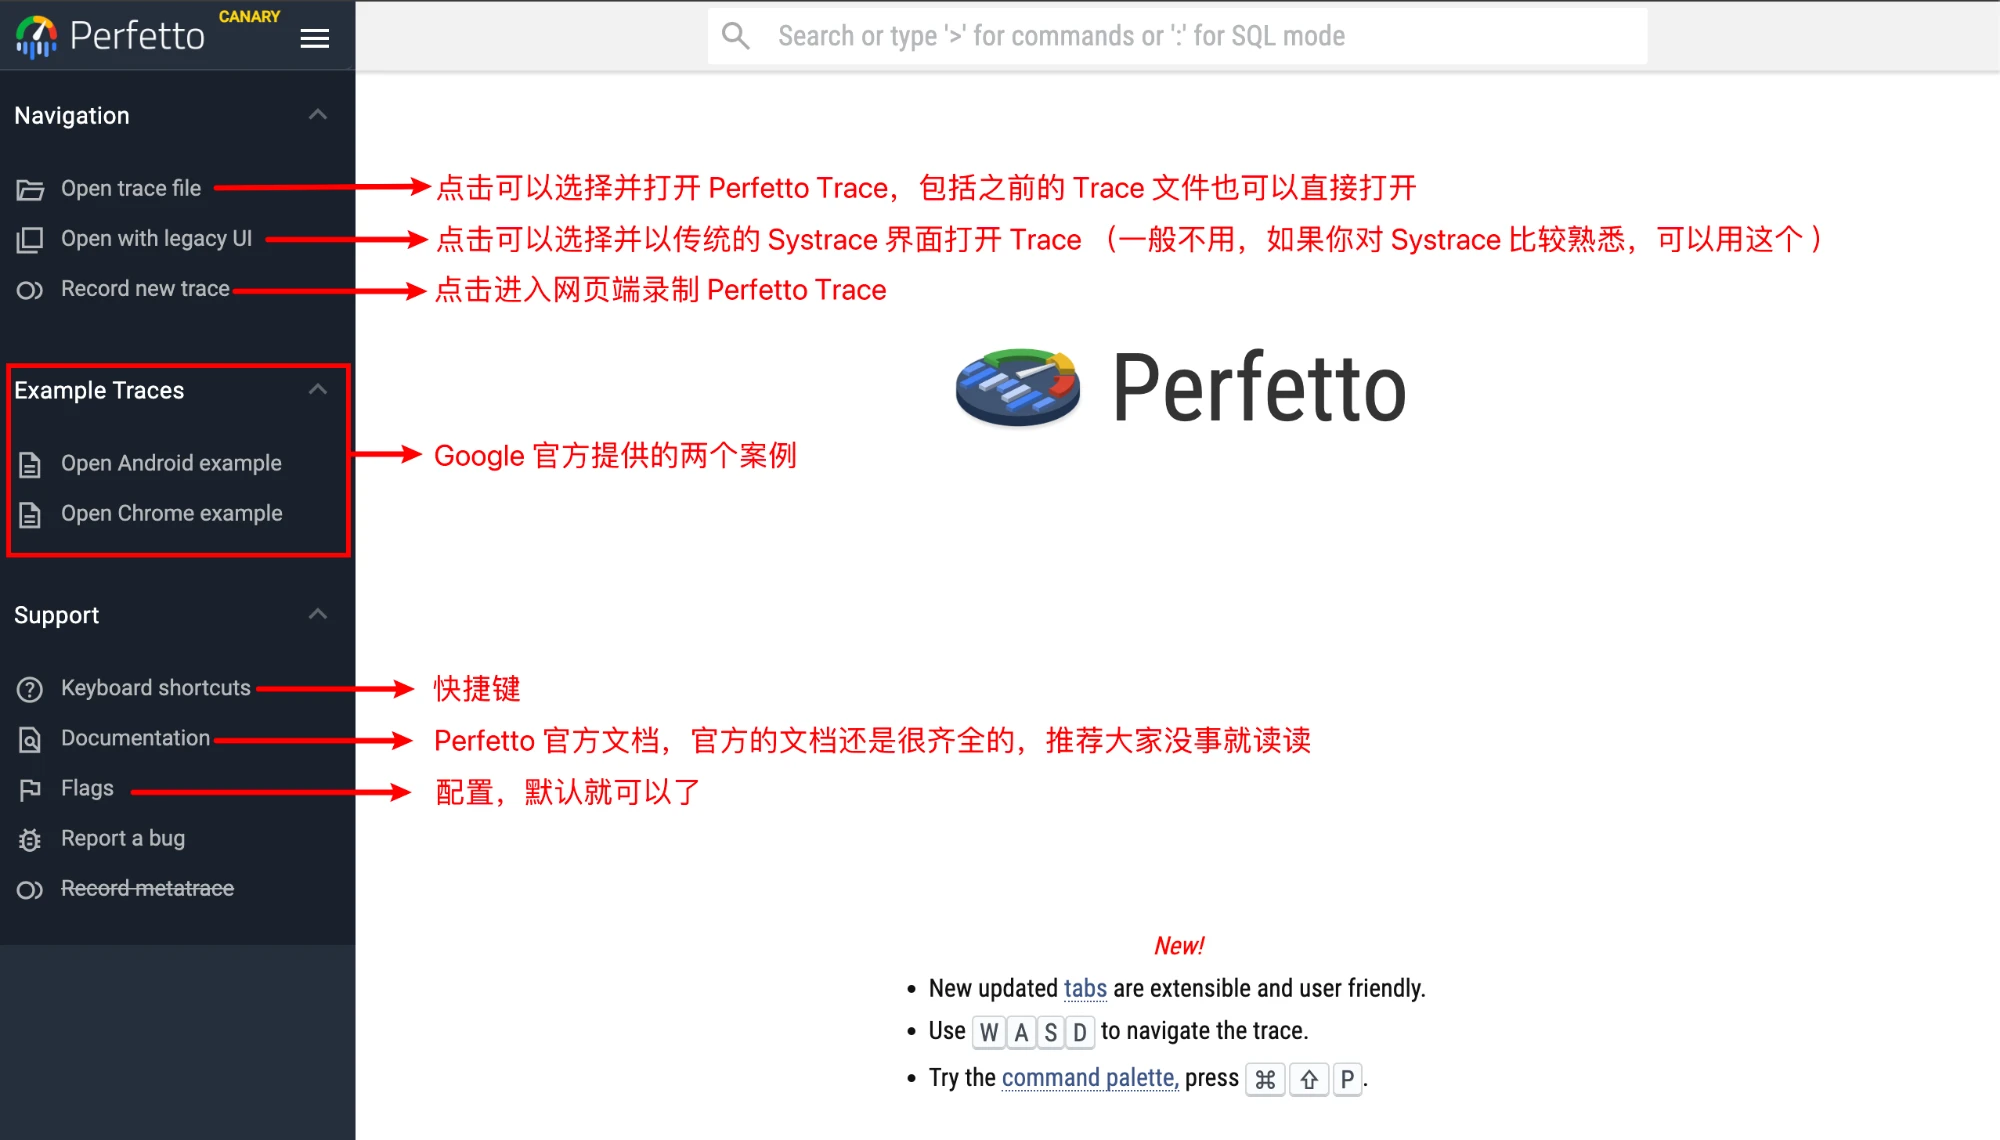
You can open Trace by Open trace file or dragging Perfetto Trace directly to the white area.
Perfetto Trace Interface
The interface after opening Perfetto Trace is as follows:
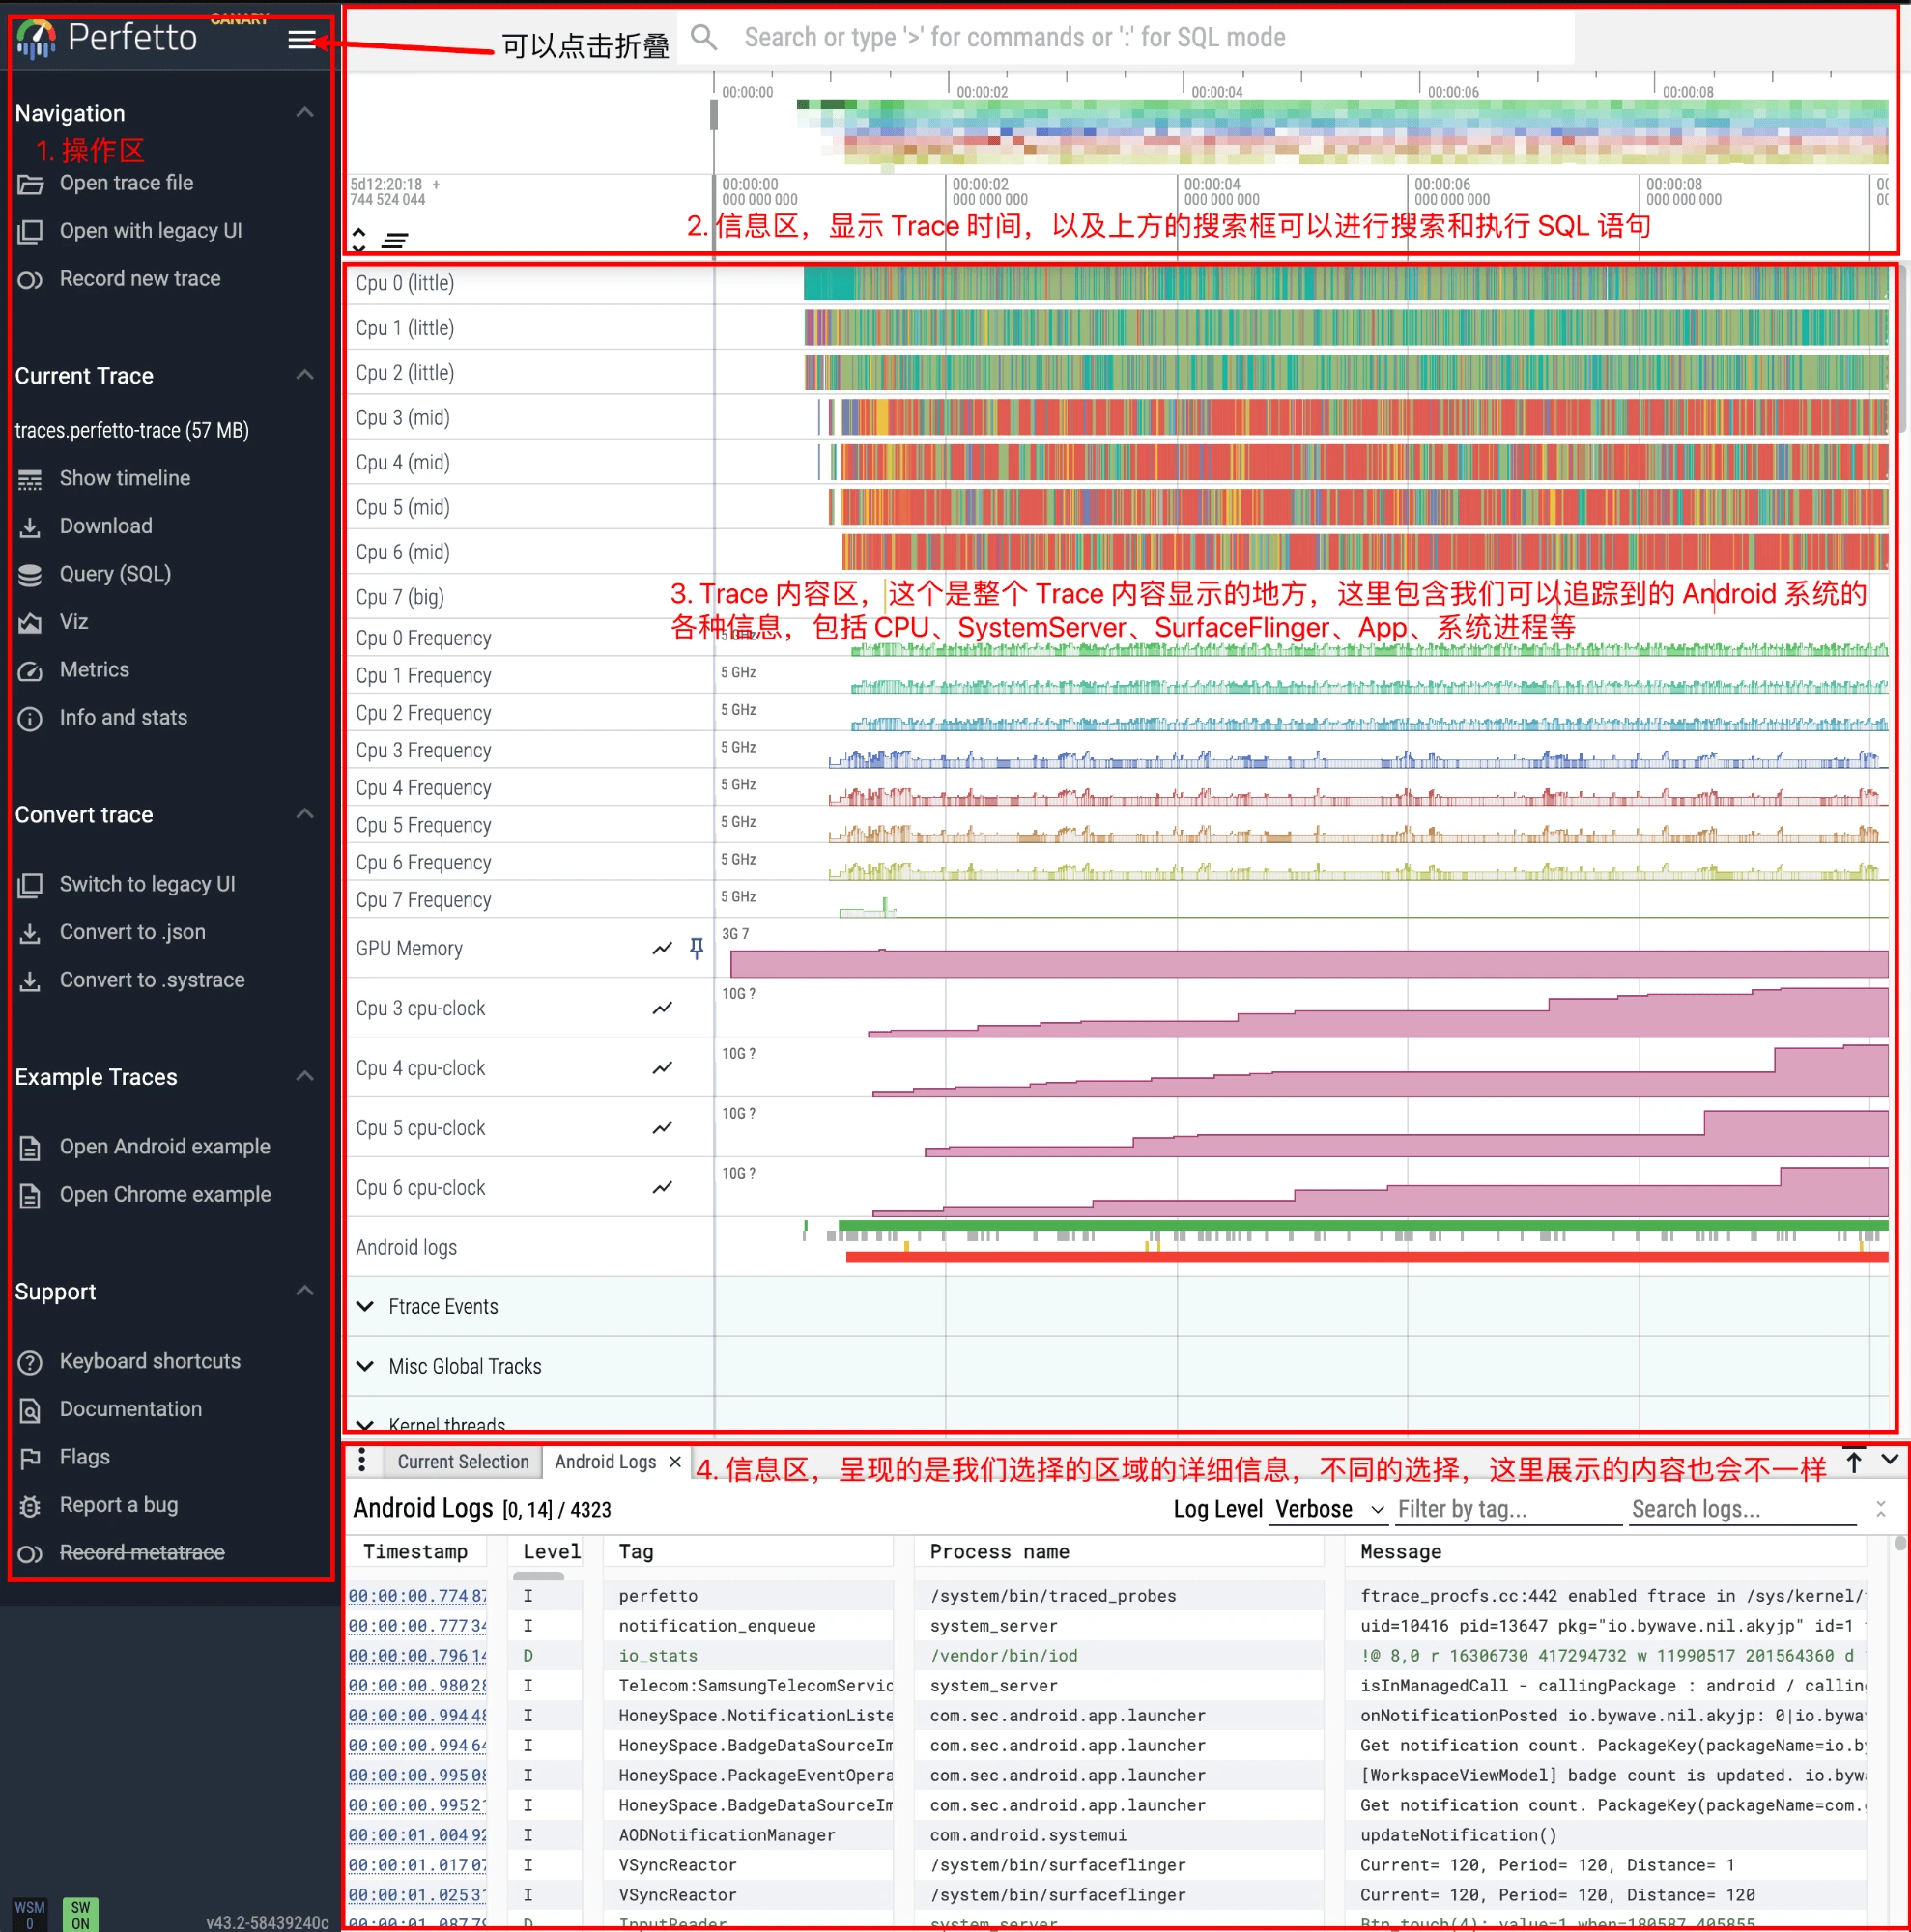
Roughly, the Perfetto Trace interface can be divided into four areas:
- The rightmost operation area: The most important thing here is the few under the Current Trace column that will be used frequently.
- Show timeline: Display current Trace, after switching to other interfaces, click this again to return to the Trace View interface
- Query: Place to write SQL query statements and view execution results
- Metrics: Some analysis results written by the official by default, you can choose to open directly
- Info and stats: Some information about the current Trace and mobile App
- Information and operation area at the top: The most important thing is to look at the time.
- Trace content area in the middle: The area with the most operations. Trace content is all in this part. The top few parts are divided into an area from the perspective of function, such as CPU area (can view which core the current Task is running on, what is the frequency, how long it runs, who woke it up), Ftrace event area, etc.; the following part is displayed in units of App Process (including App’s various threads, Input events, Binder Call, Memory, Buffer and other information).
- Information area at the bottom: This area mainly displays various information. After we select a certain Task segment, the information related to this Task will be displayed here (if you add Log, Log will also be displayed here; ftrace event is similar).
When viewing the Perfetto interface at first, it will feel very messy and flashy, but after getting used to it, it is really delicious ~
Basic Operations
The operation of the Perfetto Trace interface is very smooth, which is a huge advantage compared to Systrace. Systrace will be laggy when opening a slightly larger Trace, but Perfetto Trace is still very smooth when opening a 500Mb Trace.
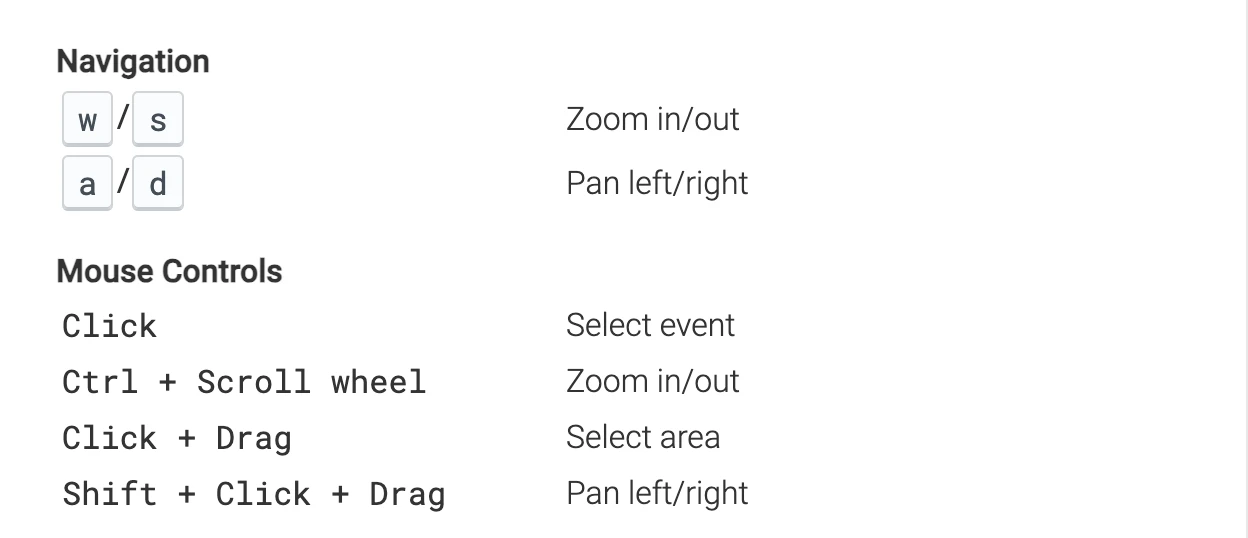
The shortcut keys for watching Trace are very similar to Systrace. w/s is to zoom in/zoom out, a/d is to move left/right, and mouse click is to select. The official document in the lower left corner has detailed operation instructions. If you forget, you can check it at any time. Practice makes perfect:
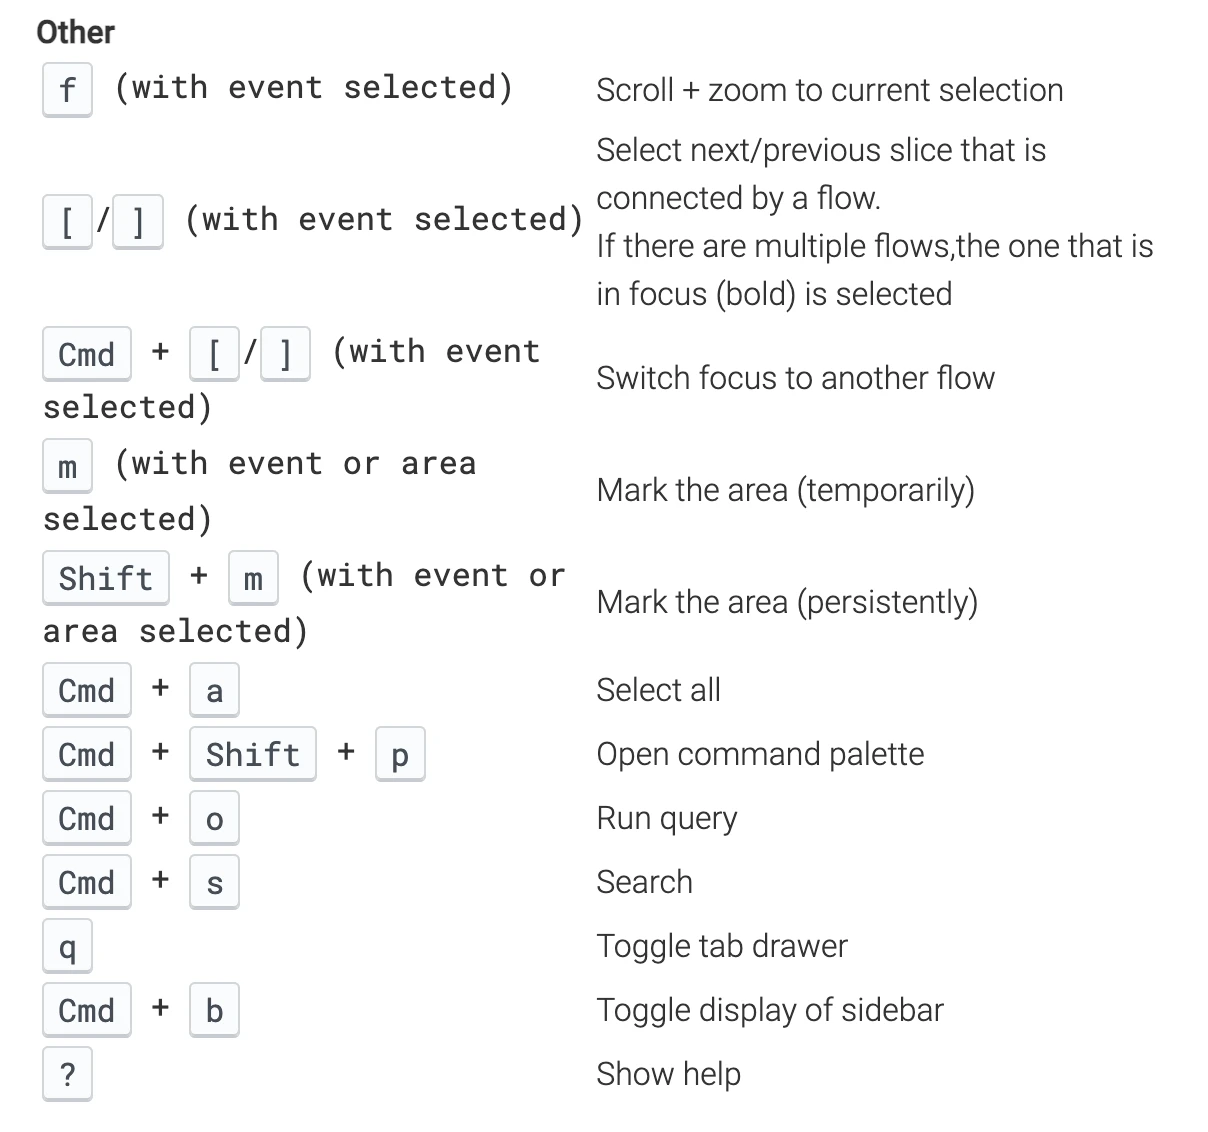
Among other shortcut keys, the more confusing ones are:
f is to zoom in on the selection
m is to temporarily Mark an area (same as Systrace), used to look at time up and down, look at other process information, etc. Temporary means that if you press m to mark another area, the Mark area marked by the previous m will disappear. Exit temporary selection: esc, or select other Slice and press m, the selection effect of this currently Slice will disappear
shift + m is to continuously Mark an area (if you don’t click, it won’t disappear), mainly used to Mark a piece of information for a long time. For example, if you Mark all the frame drop points in a Trace, you can use shift + m, so that it will not be lost.
Click on the small flag to see the execution information within this interval
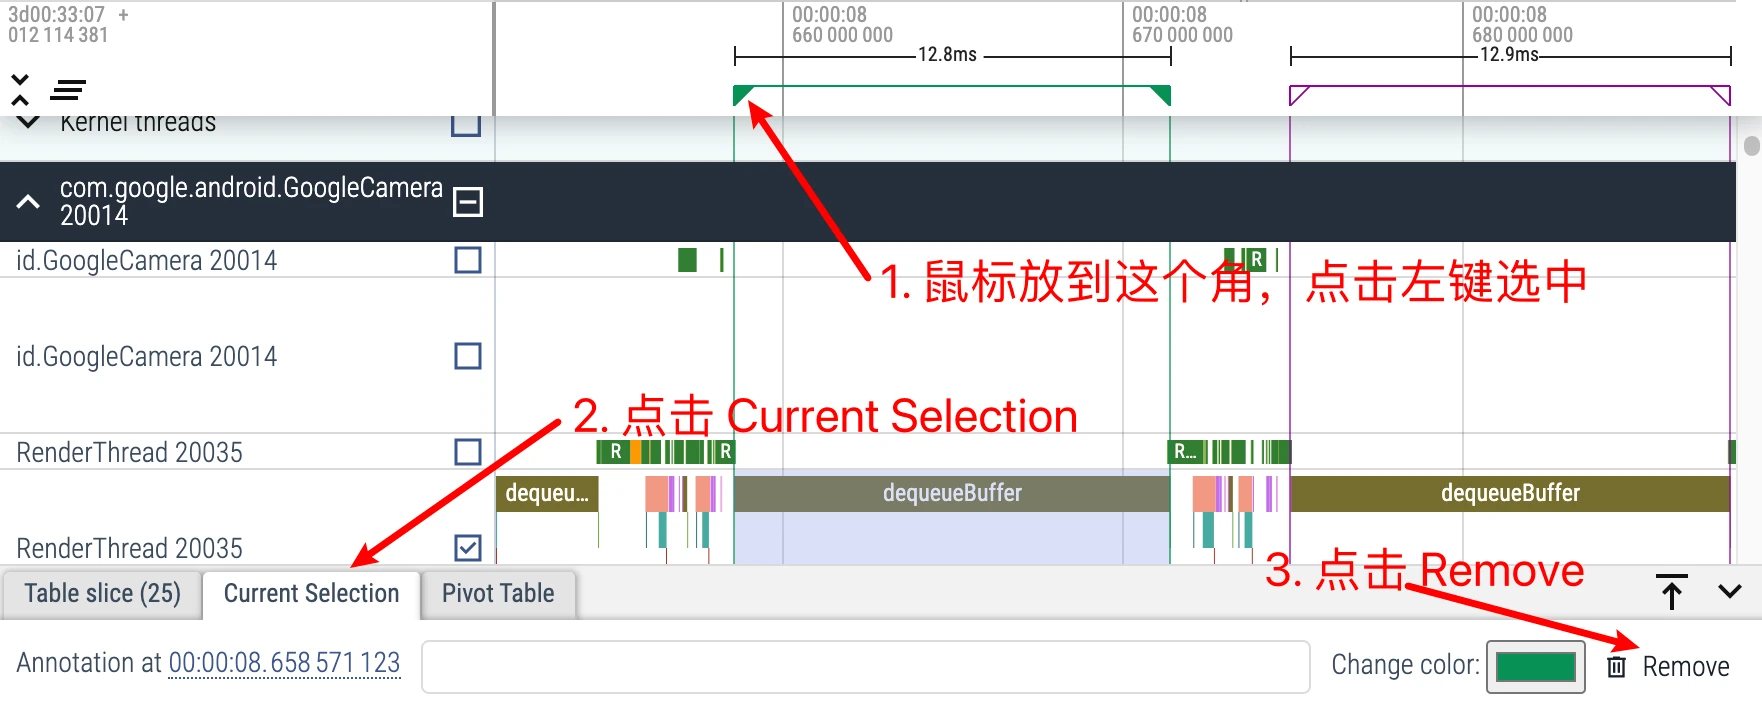
Delete continuous Mark
- Click on the triangle at the top of the Slice you selected
- Select Tab below: Current Selection
- Click Remove on the far right, and you can Remove it
q: Hide and show the information Tab. Since Perfetto occupies the screen very much, it is very important to use the q key proficiently. Open it quickly when watching, and close it quickly after watching.
Flagging: Perfetto can also use the method of inserting flags to make marks on Trace. Perfetto supports you to put the mouse on the top of Trace, and a flag will appear. Click the left button to insert a flag on it, which is convenient for us to mark the occurrence of an event, or a certain time point
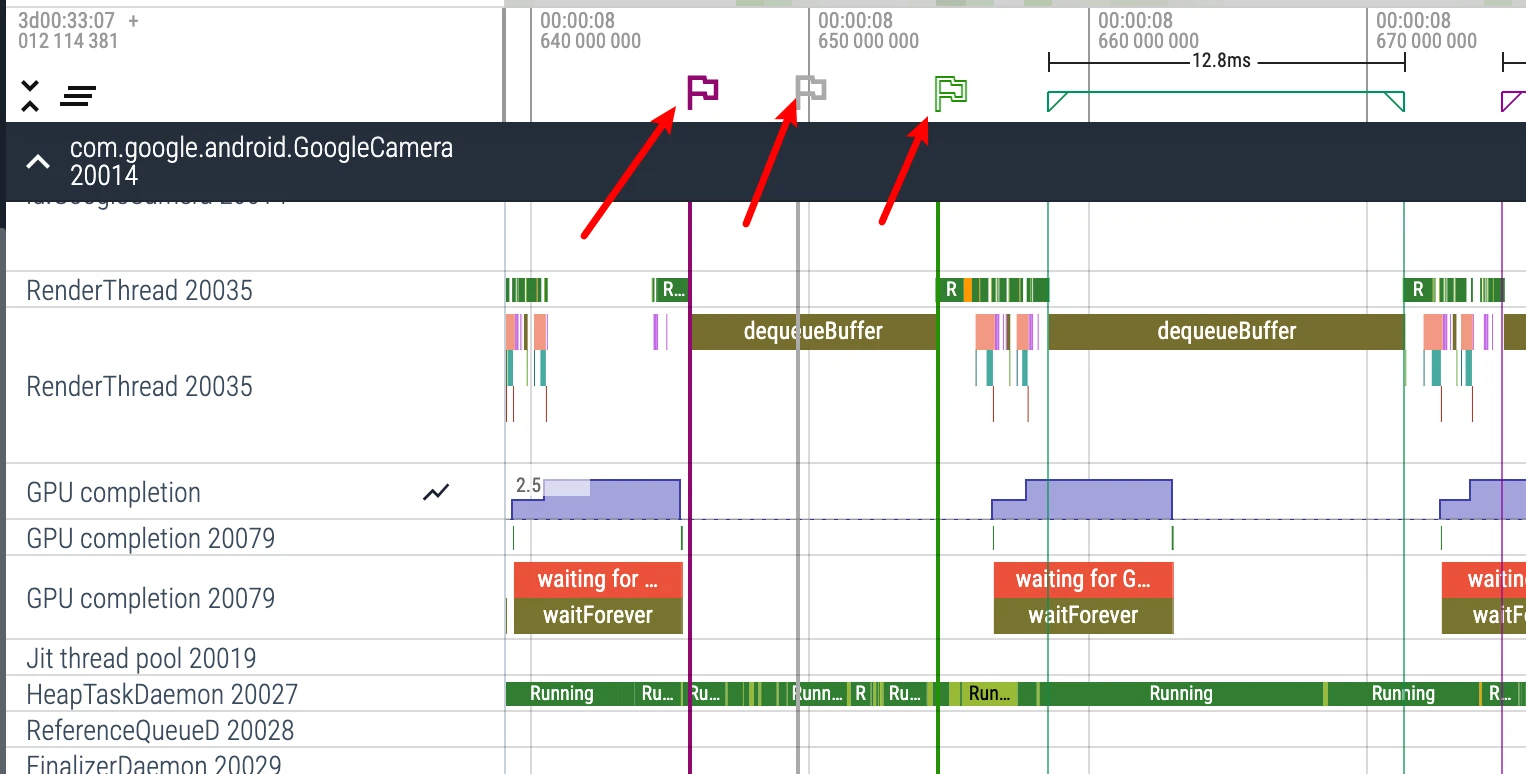
- Cancel the inserted flag: Same as exiting continuous selection, click the flag, there is a Remove in the lower right corner, click to kill this flag, I won’t insert the picture.
Perfetto Usage Tips
Check Wakeup Source
We can check the wake-up source of a Task to understand the operation process of App and Framework. Both Systrace and Perfetto can check the wake-up source, but Perfetto is smoother in this regard.
In the article Android Systrace Response Speed Practice 3: Response Speed Extended Knowledge, I talked about how Systrace checks the wake-up source. In fact, it is still a bit troublesome. Checking the wake-up source in Perfetto is very convenient and the operation is very smooth:
For example, if we want to see who woke up RenderThread in the details below, we can have several methods:
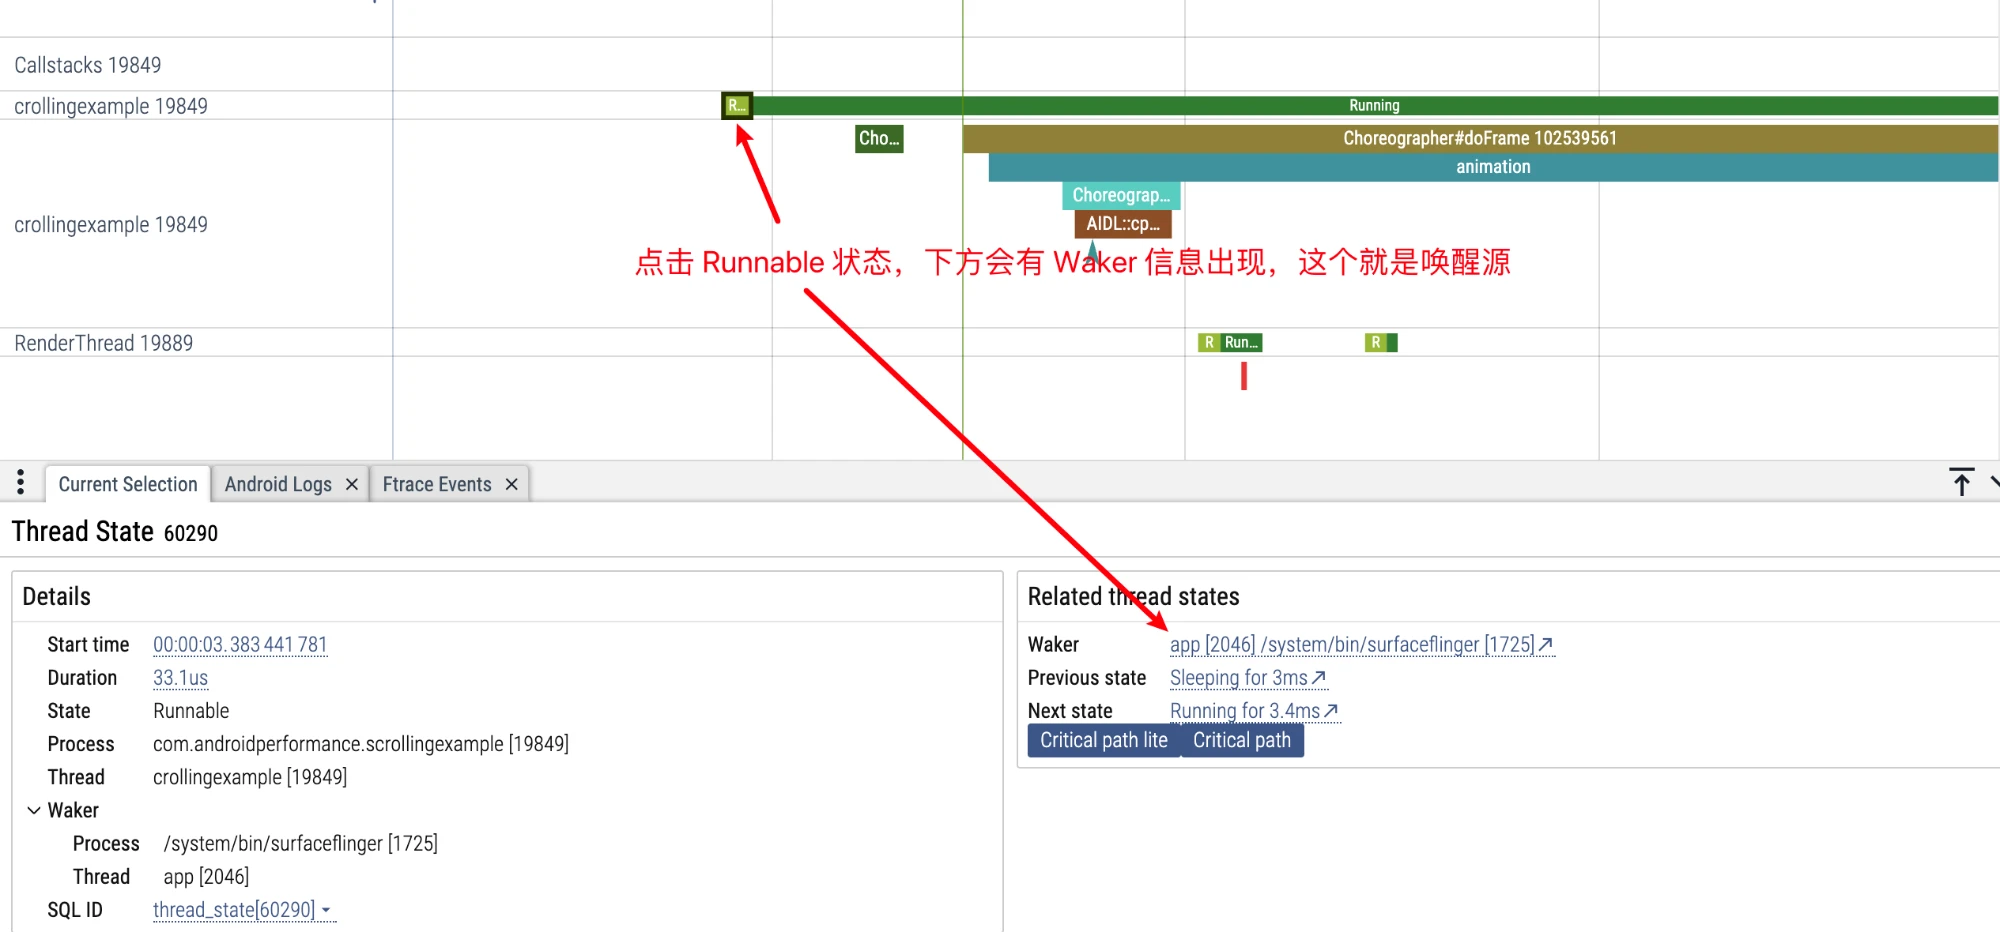
Click Runnable Status
Like the Systrace operation, click Runnable directly in front of Running, and you can see Related thread states in the information area below:
- Waker: Wake-up source
- Previous state: The previous state of this Task
- Next state: The next state of this Task
Click the Running status above it to view continuous wake-up information:
Or we can click the Running status, click the small arrow to jump directly to the corresponding CPU Info area, where more detailed information can be seen. You can also click Task continuously to trace the wake-up source, and jump back and forth between the CPU Info area and the Task area through the small arrow in the information area.
Click the Running status above RenderThread to jump to the CPU Info area via the small arrow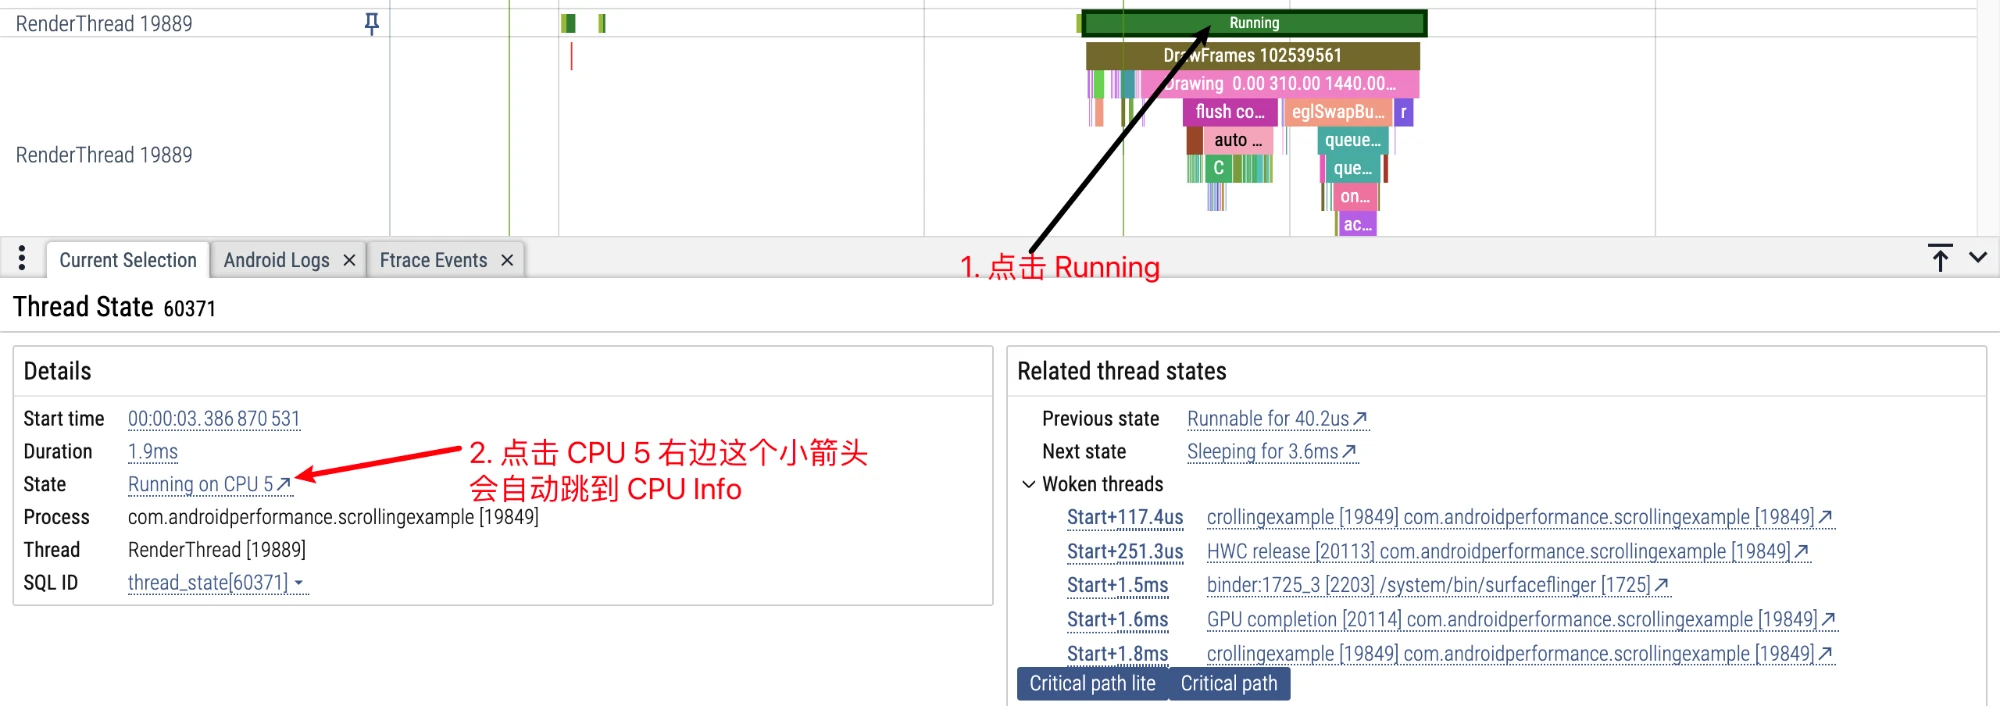
RenderThread is woken up by MainThread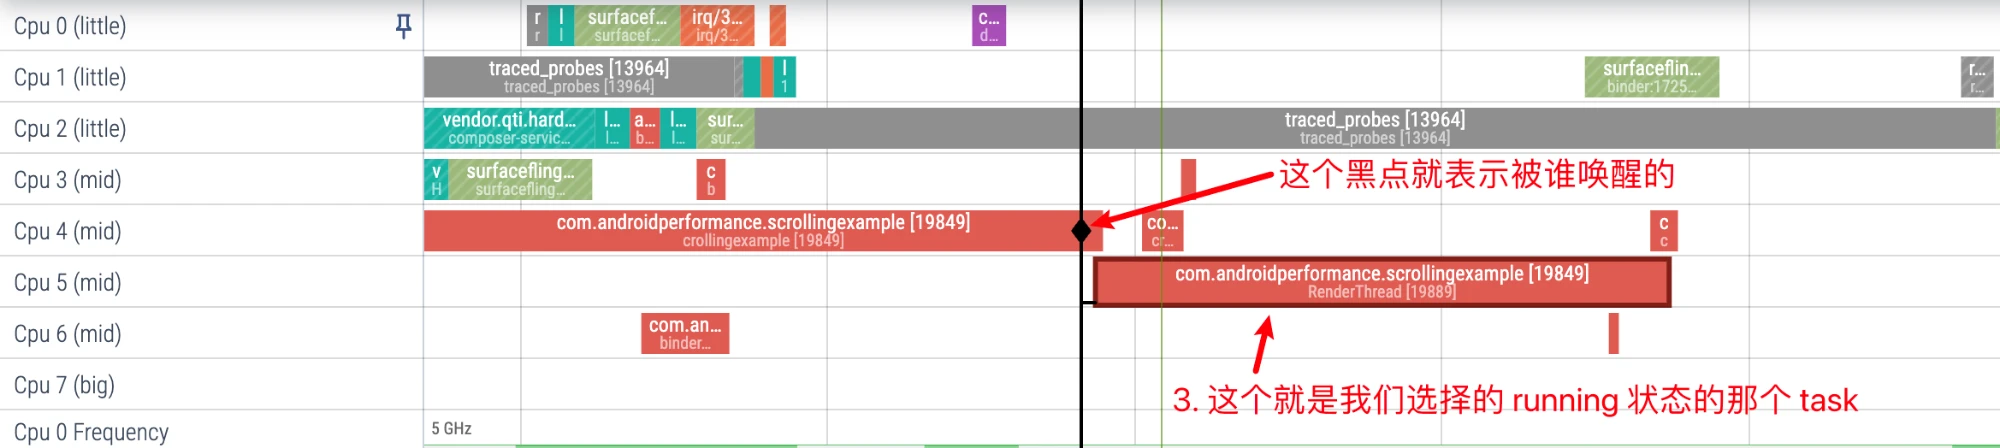
Click MainThread again to see that it is woken up by SurfaceFlinger. There is also a corresponding wake-up delay analysis in the information area below.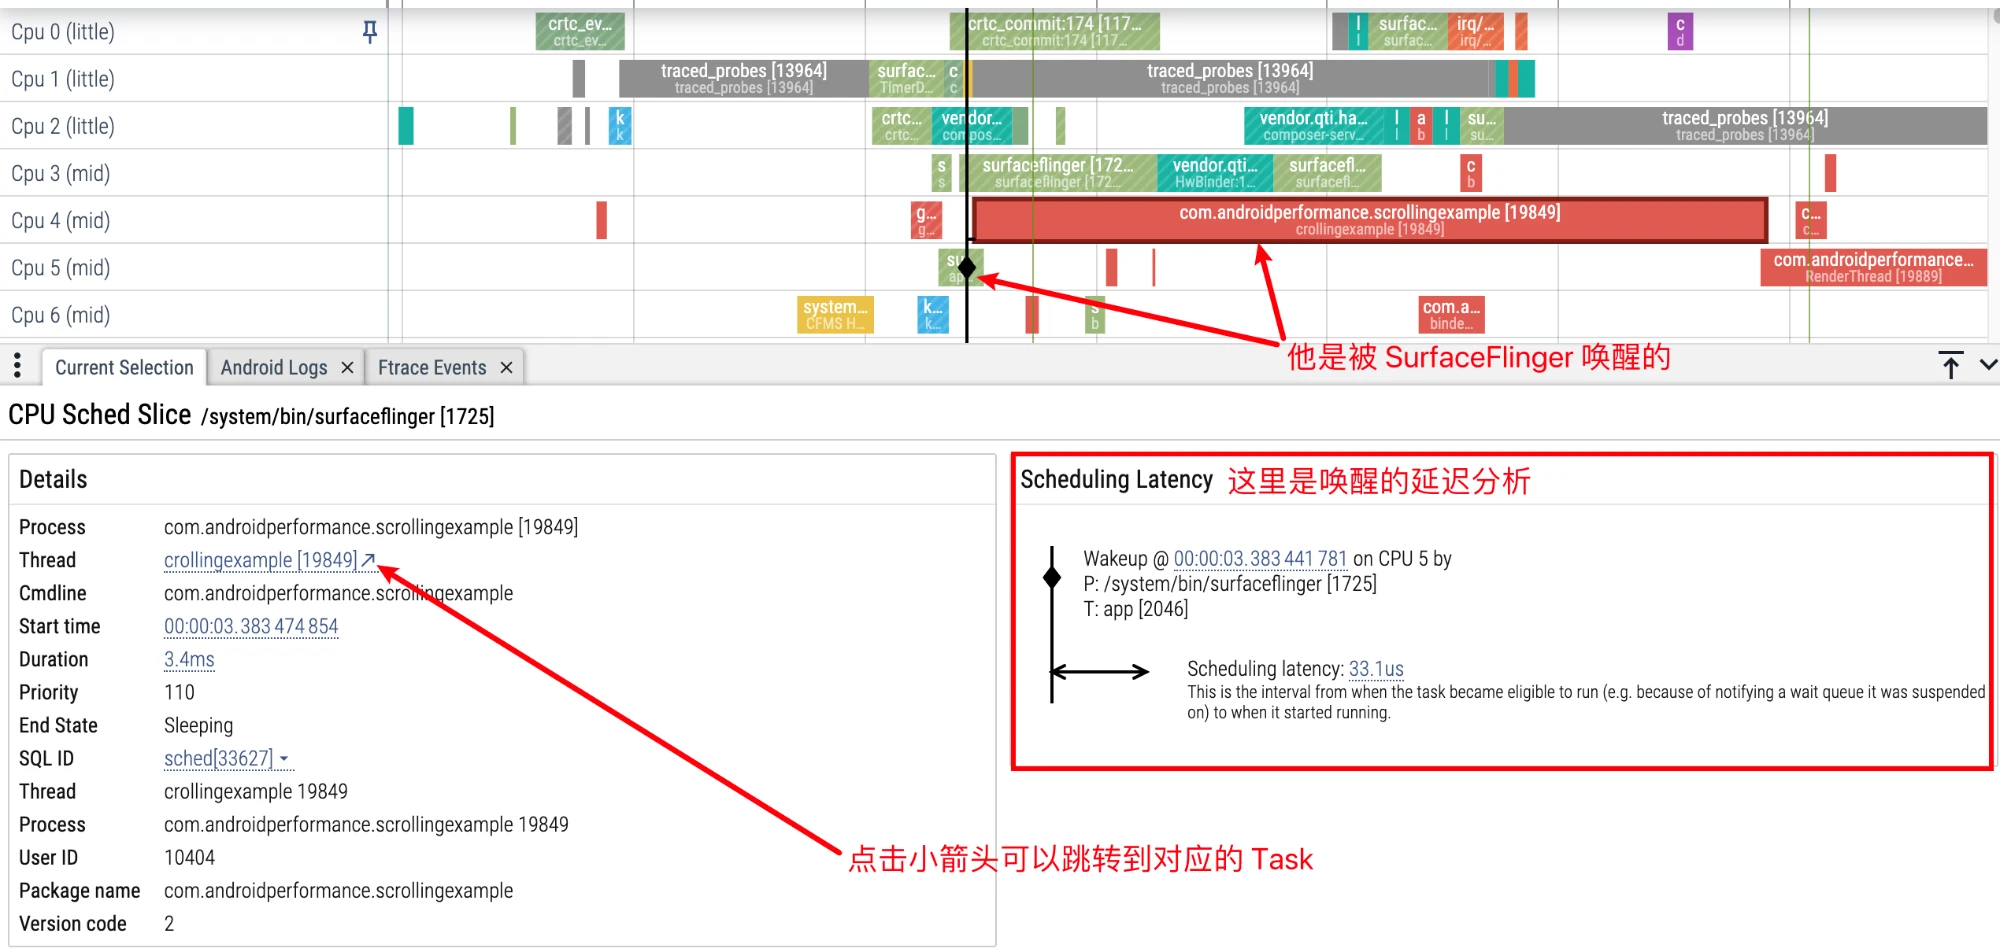
Check Critical Path (Task)
Critical Task refers to the Task that has a dependency relationship with the Task currently selected by us. For example, if our Task is e, e can only be executed after d is executed, d has to wait for c, c has to wait for b, and b has to wait for a, then the Critical Task of e is a, b, c, d.
Perfetto can verify the Critical Task of a certain Task. Given that Critical path lite is a subset of Critical path, we only introduce Critical path here:
Click Running status, and then click Critical path in the information area below.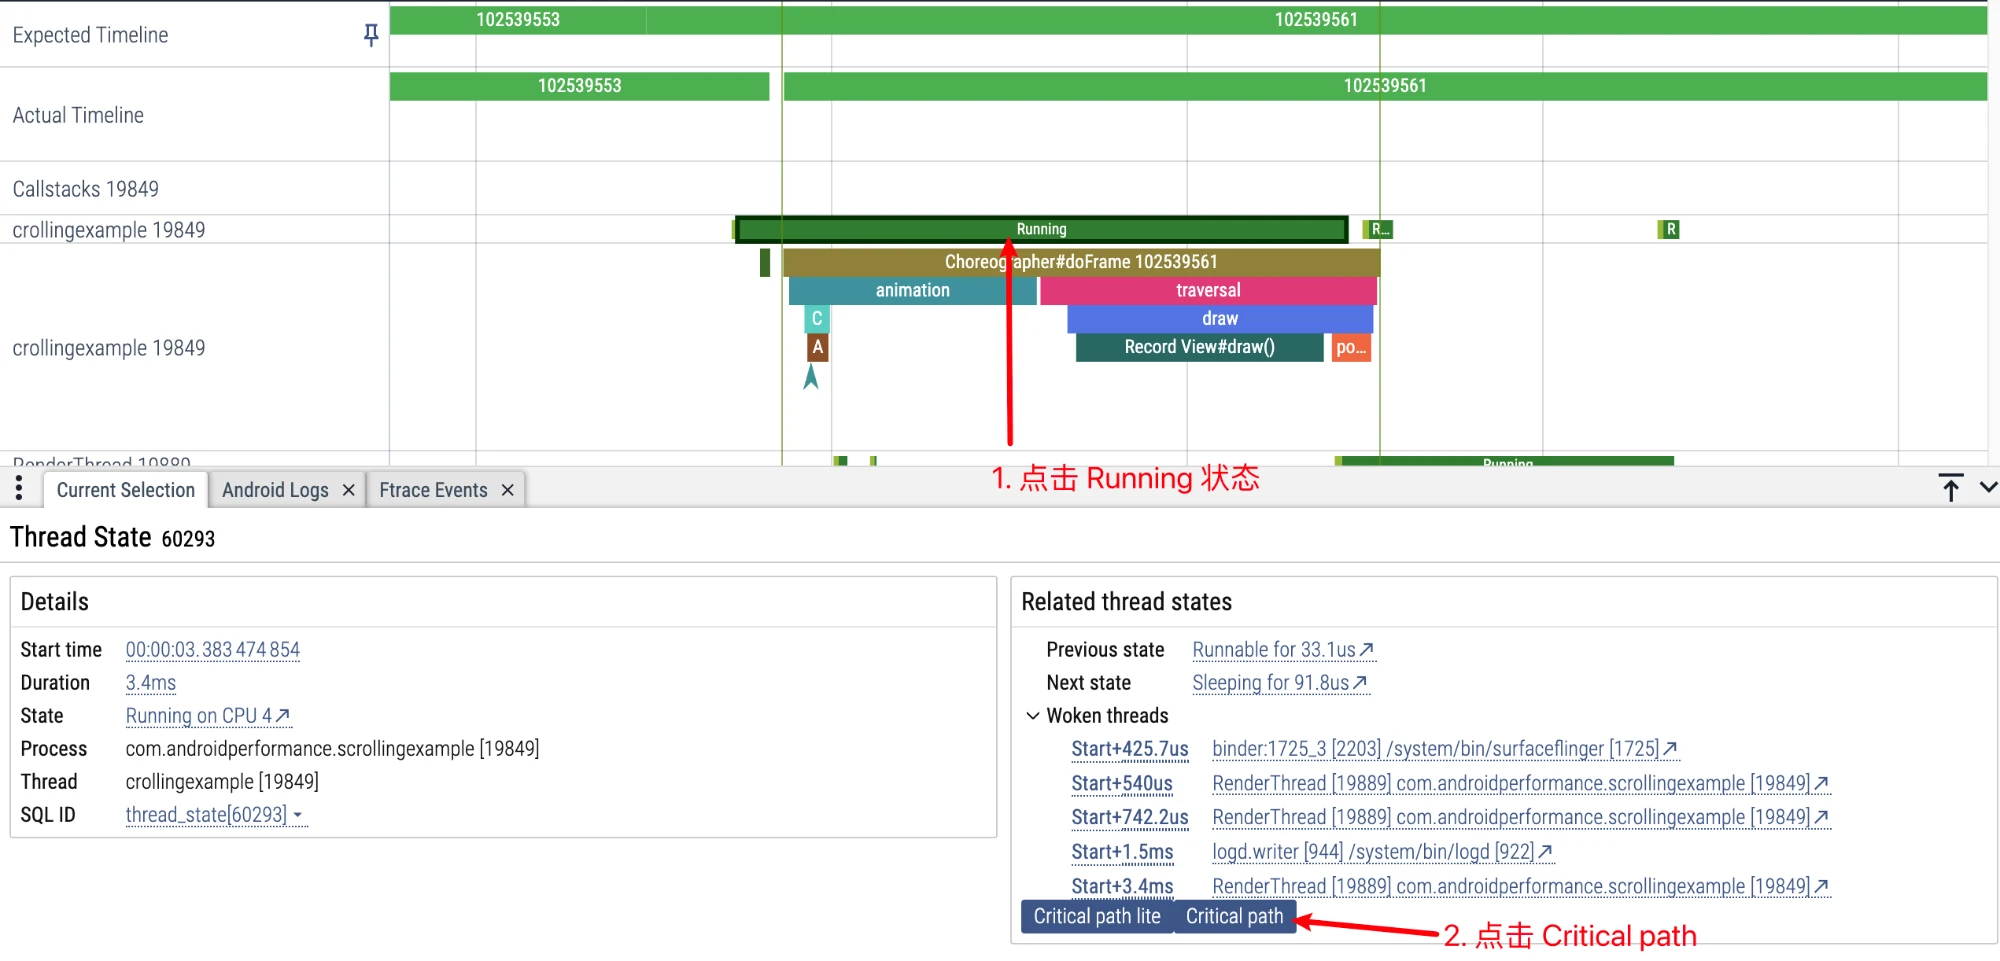
Wait for a moment to see the Critical path corresponding to the MainThread we selected:
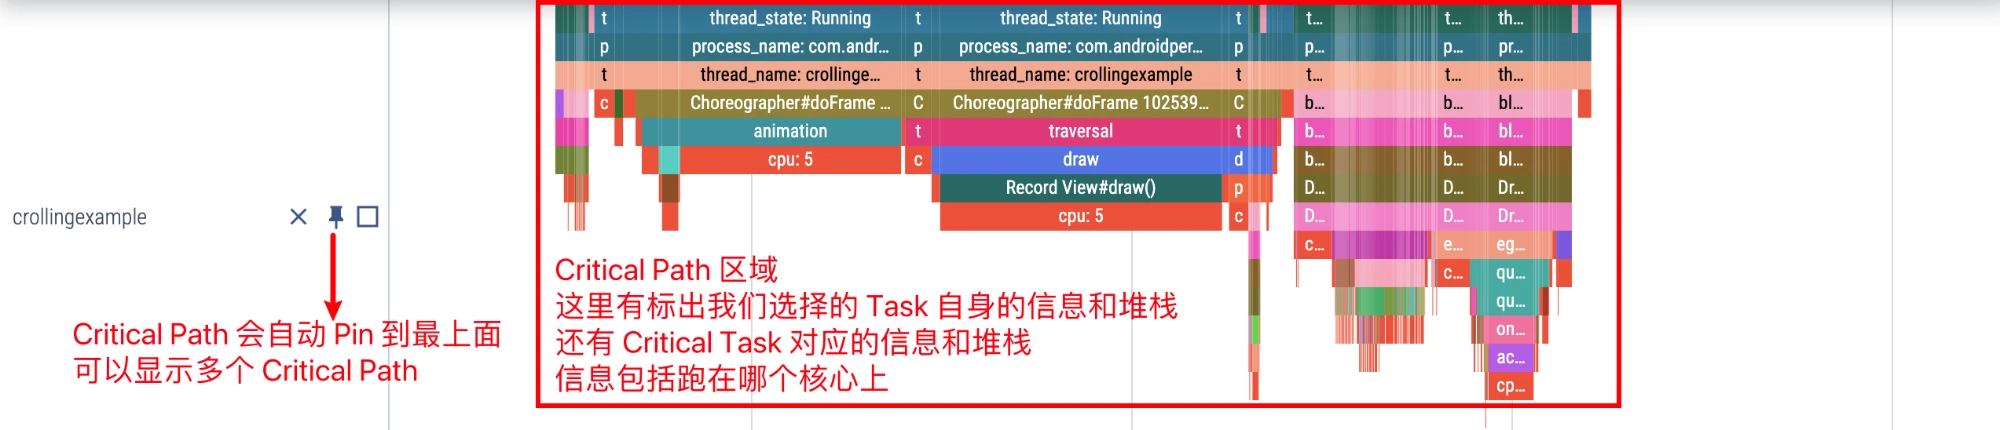
Zooming in, checking at the edge of the MainThread we selected, the first Critical Task is the app thread of sf that woke him up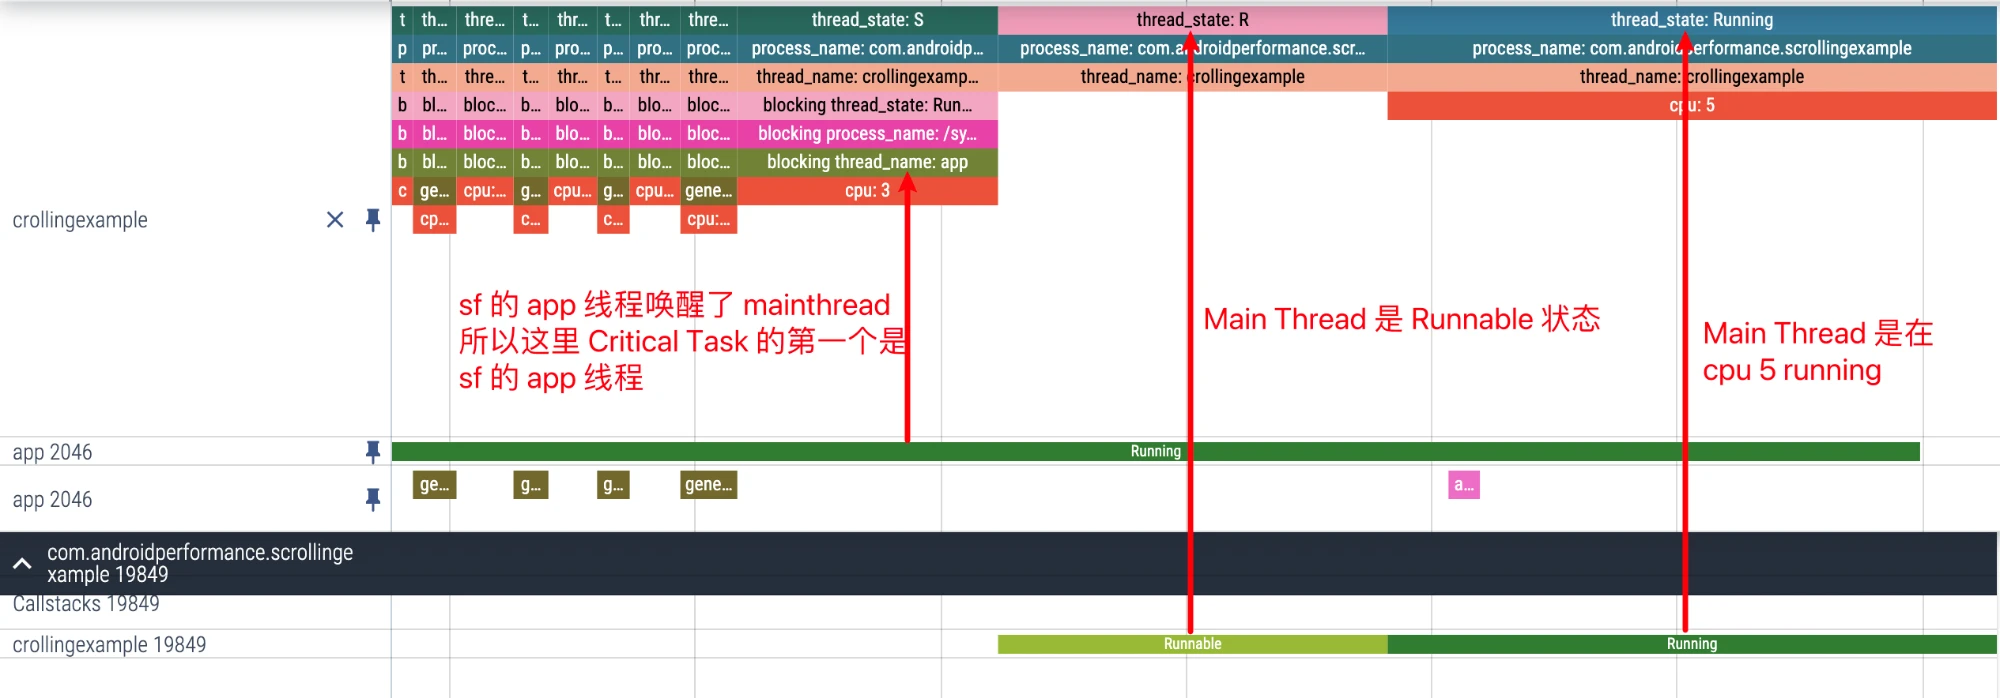
Looking to the left, the app thread of sf is woken up by the TimerDispatch thread of sf, which is not posted here.
In fact, it can be seen that the Critical Path provided by Perfetto actually gathers consecutive wake-up Tasks together, which is convenient for us to see the relationship between various Tasks.
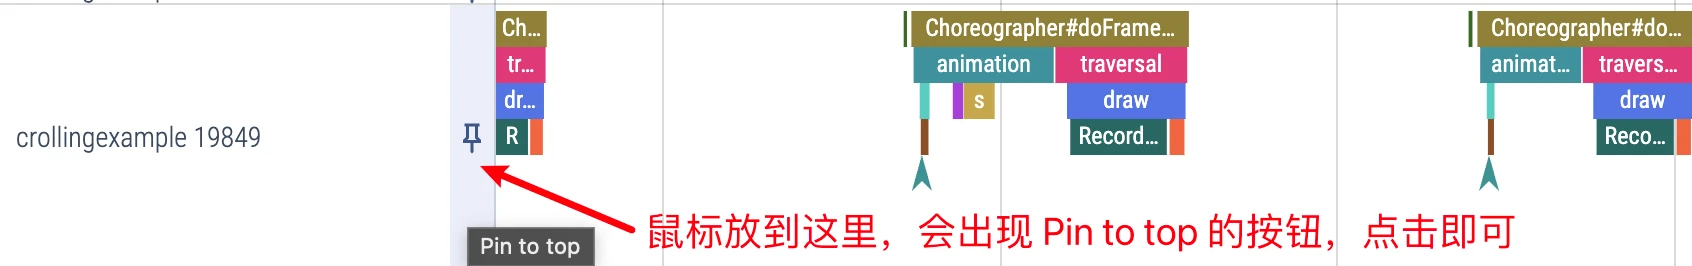
Pin (Fix to Top)
On the far left of each Thread, there is a button like a thumbtack. After clicking, this Thread will be fixed to the top, which is convenient for us to put the Threads we are most concerned about together.
For example, the following is the flow chart from App to SF that I Pin. It will be much clearer if put together, and it will be more convenient to watch frame drops.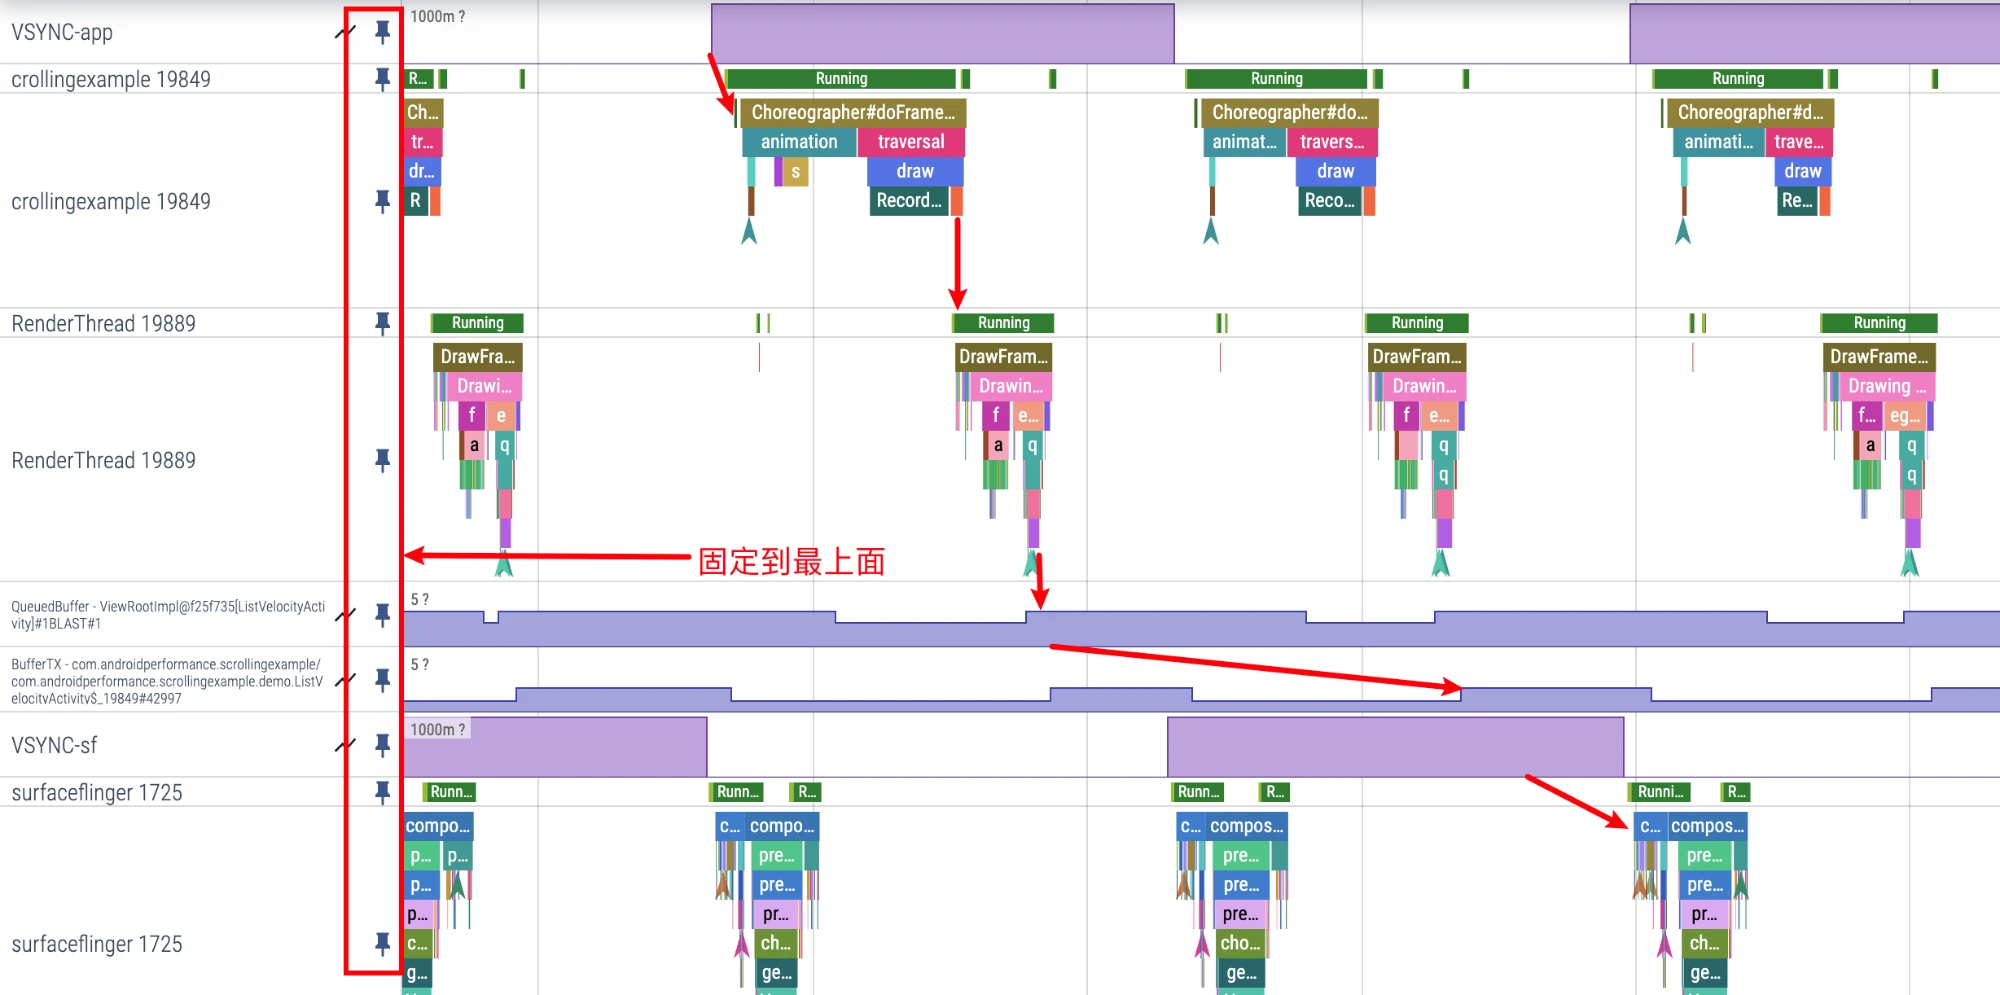
CPU Info Area Task Highlight
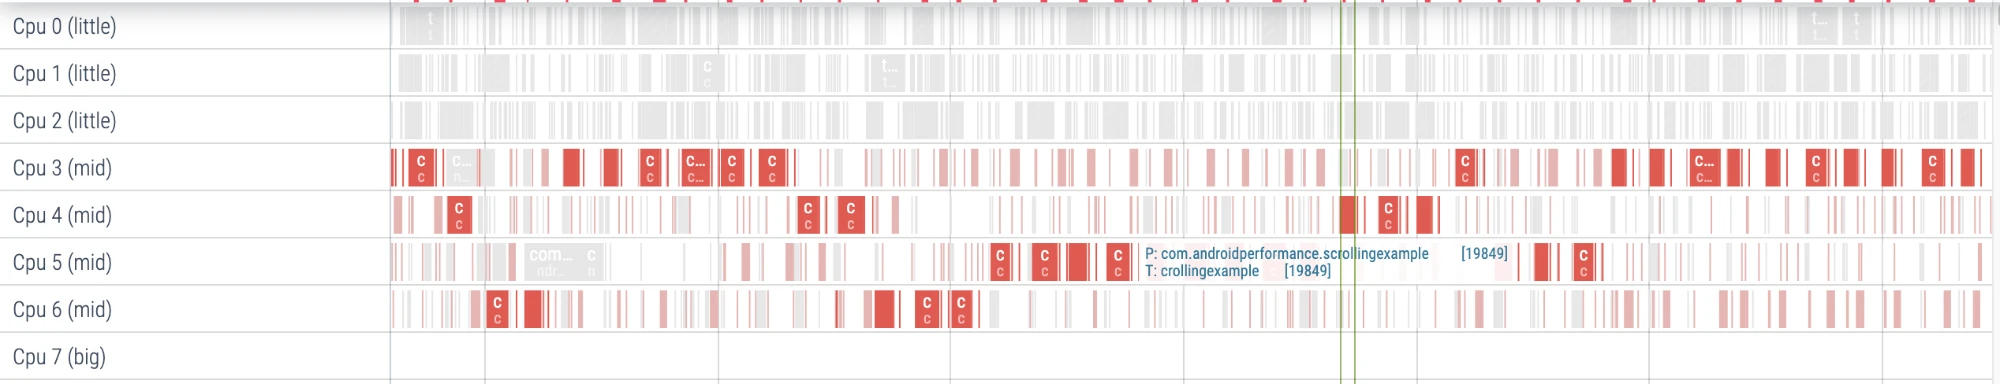
In the CPU Info area, if you put the mouse on a certain Task, other Tasks of the Thread corresponding to this Task will be highlighted.
We often use this method to preliminarily check the core placement information of certain Threads.
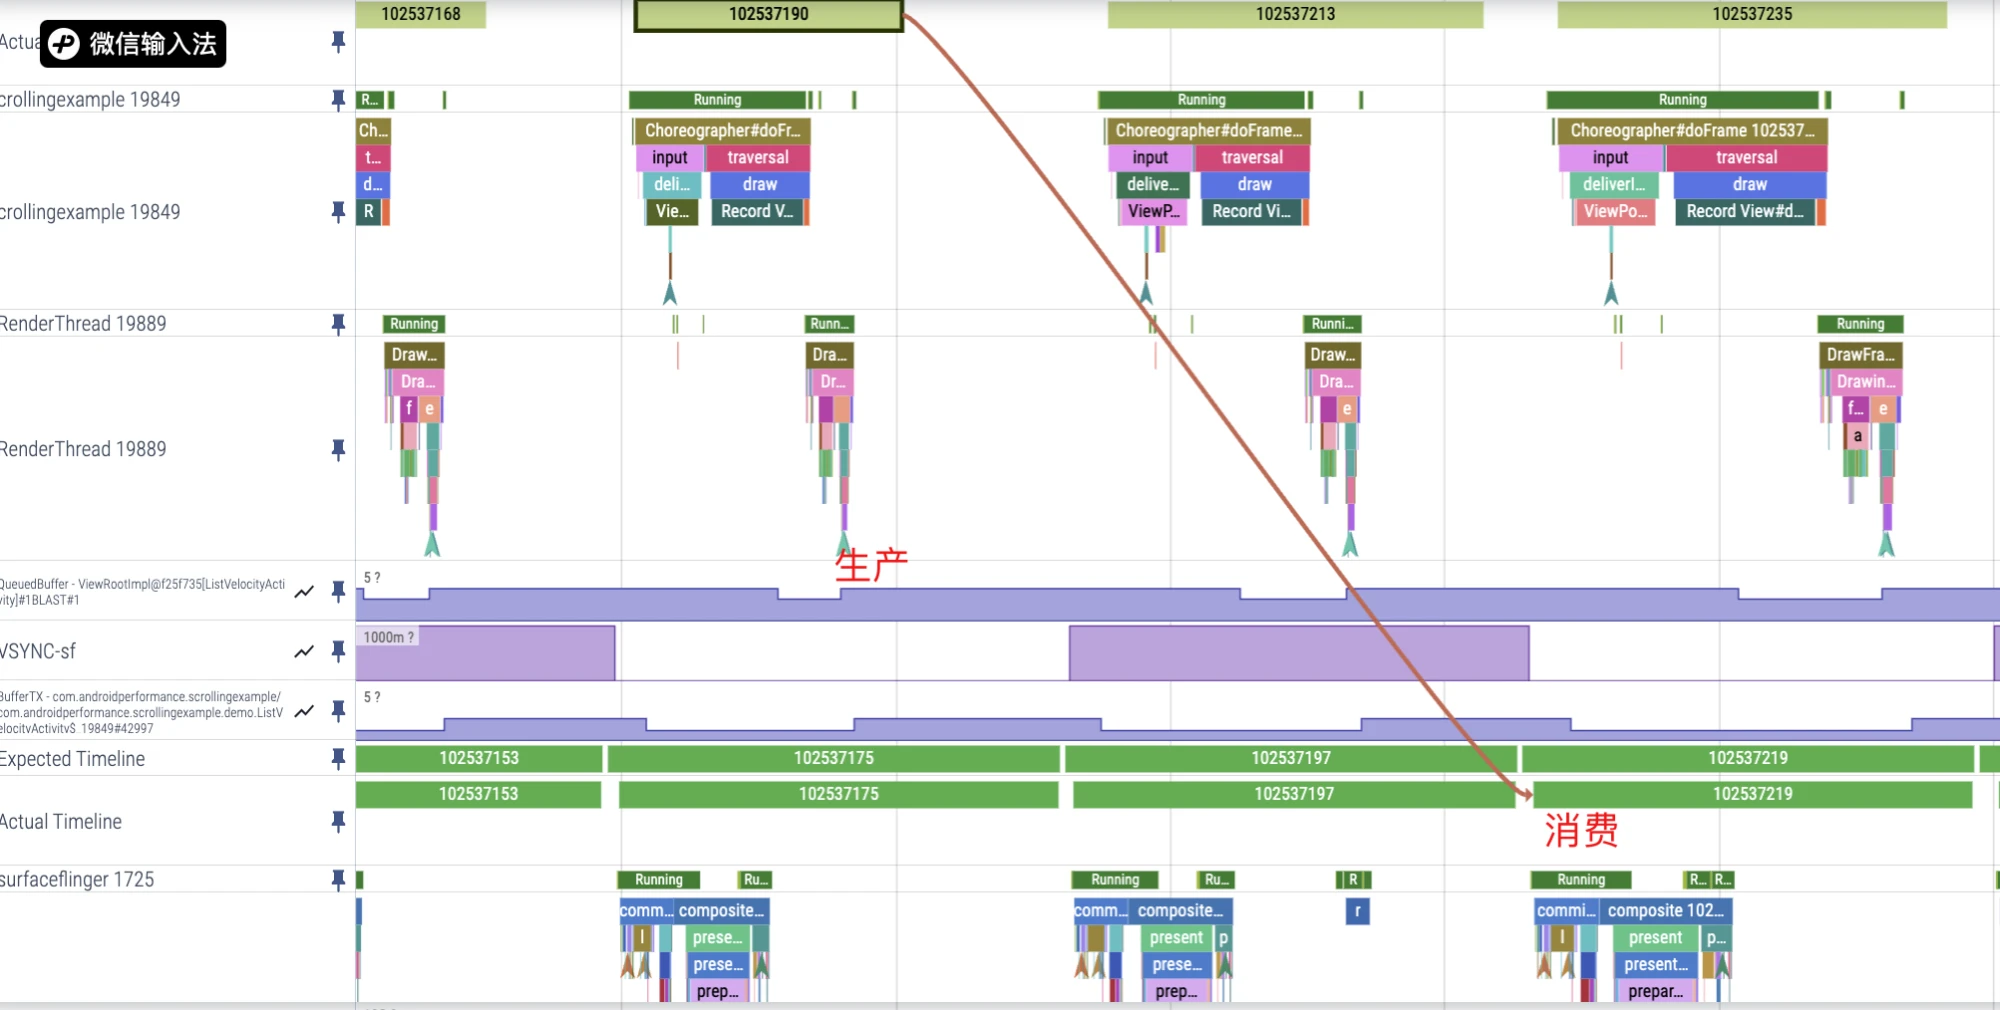
Check Buffer Consumption Stats
The Buffer consumer of App is SurfaceFlinger. Through the Actual Timeline line on the App Process side, we can see specifically which frame of SurfaceFlinger consumed the Buffer.
Quickly Check App Execution Timeout
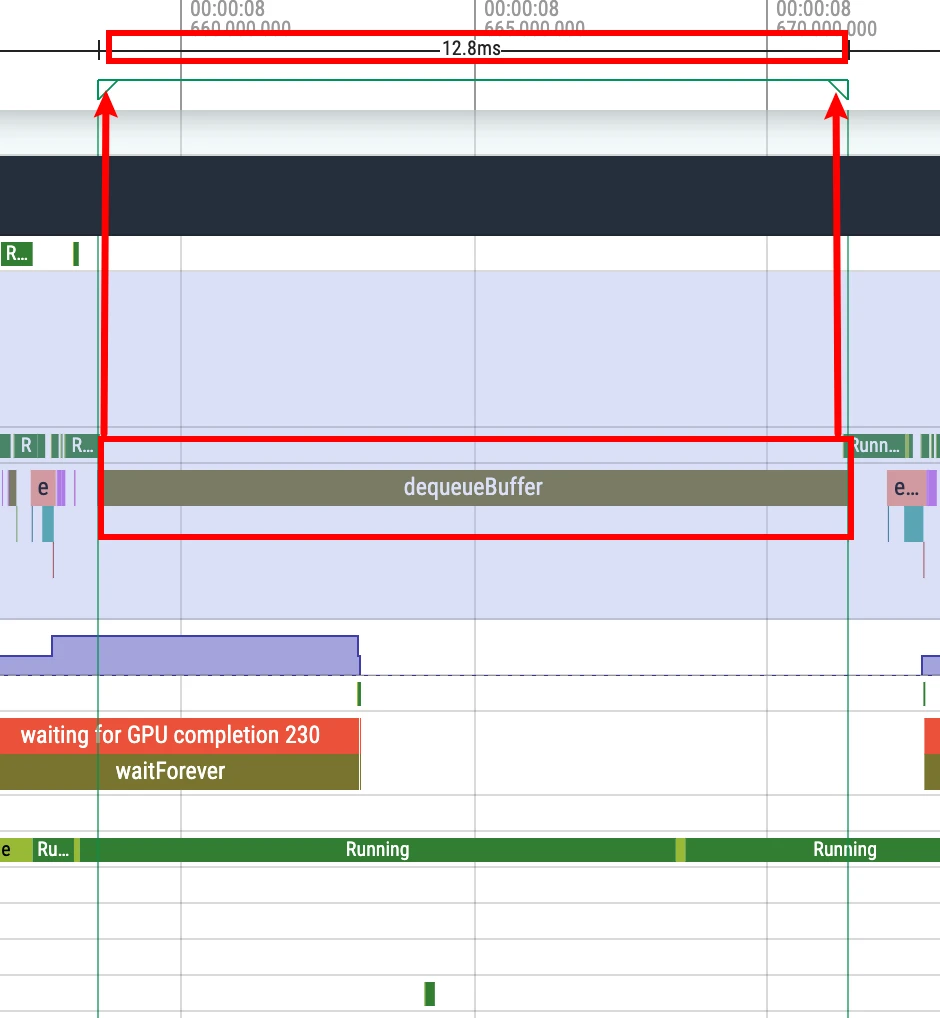
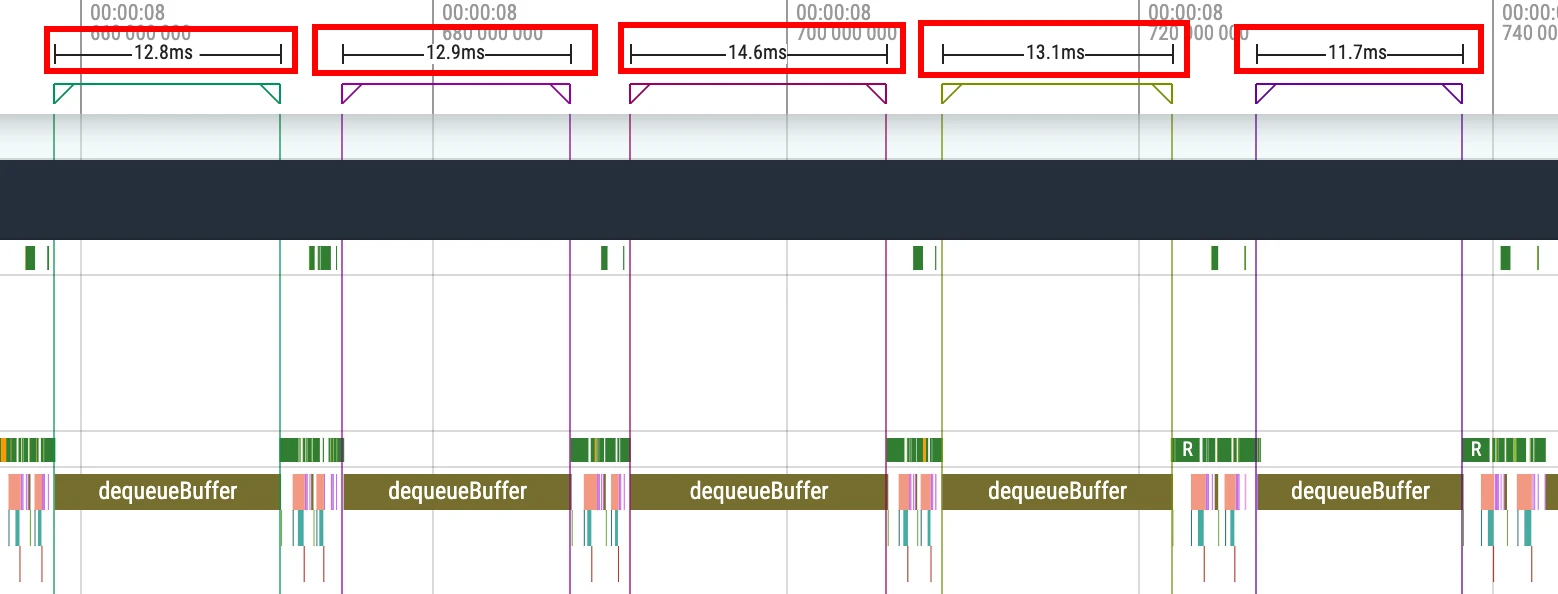
Due to the existence of Android’s multi-Buffer mechanism, App execution timeout does not necessarily cause stuttering, but timeout requires our attention.
Through the Expected Timeline and Actual Timeline provided by Perfetto, we can clearly see where execution times out.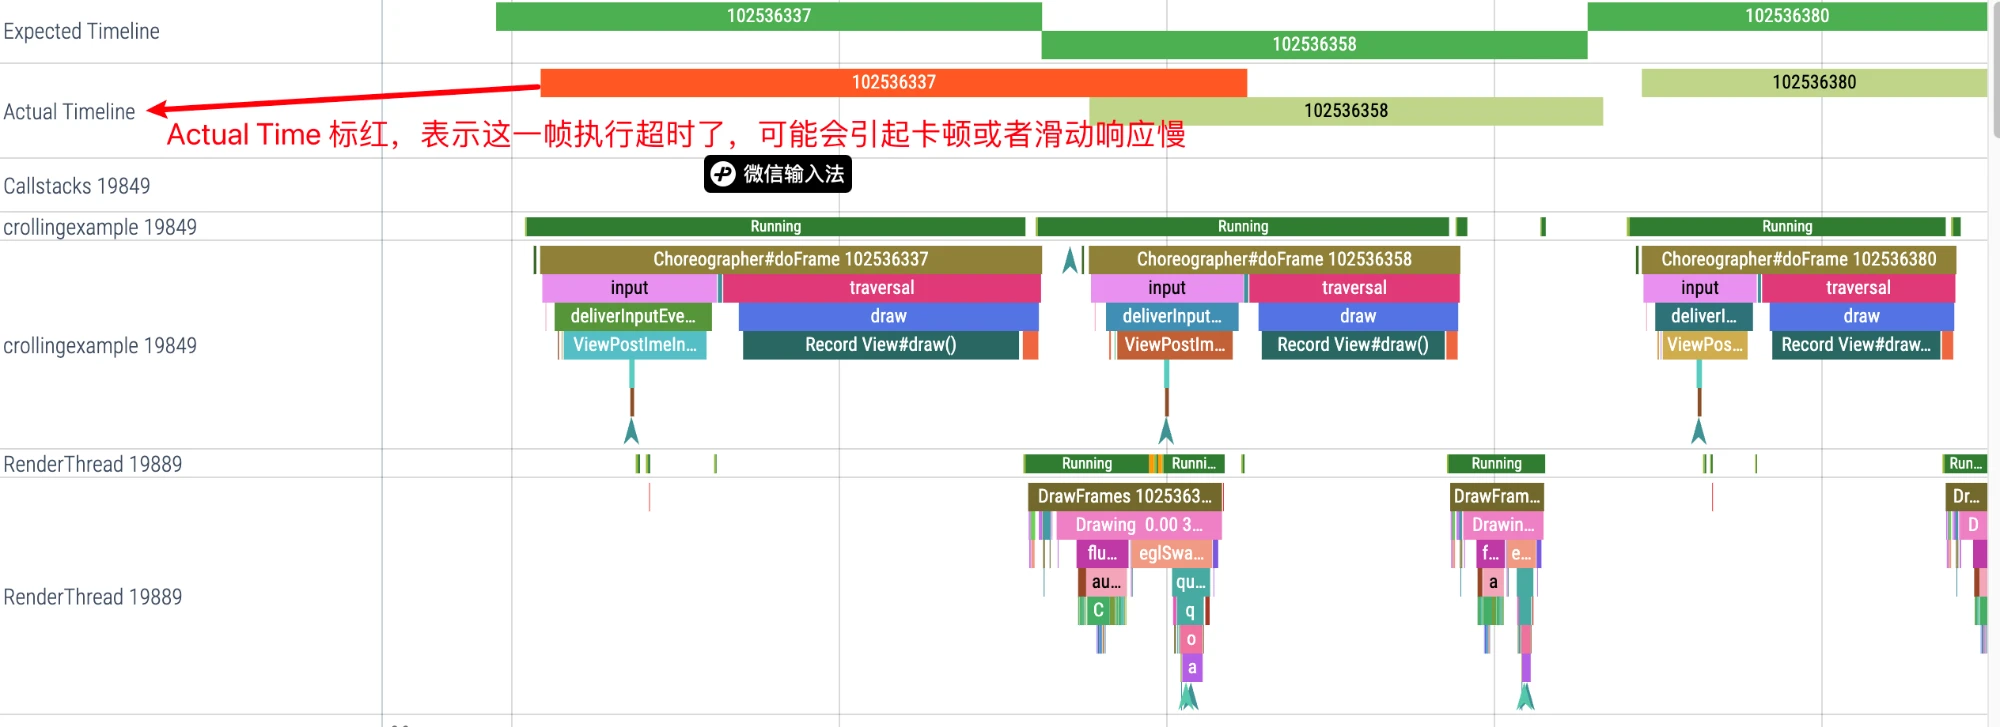
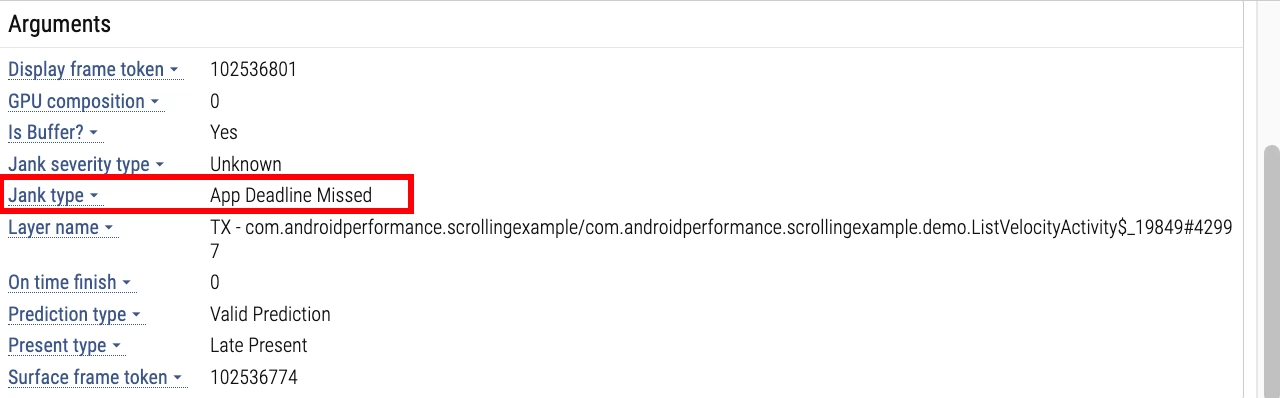
Click the red section of Actial Timeline, and the information bar at the bottom will display the reason for the frame drop:
View Log on Perfetto
Switch to the Android Logs Tab on the information bar. If you put the mouse on a certain line, Perfetto will pull a straight line on the corresponding Timeline, and you can see the time corresponding to this Log.
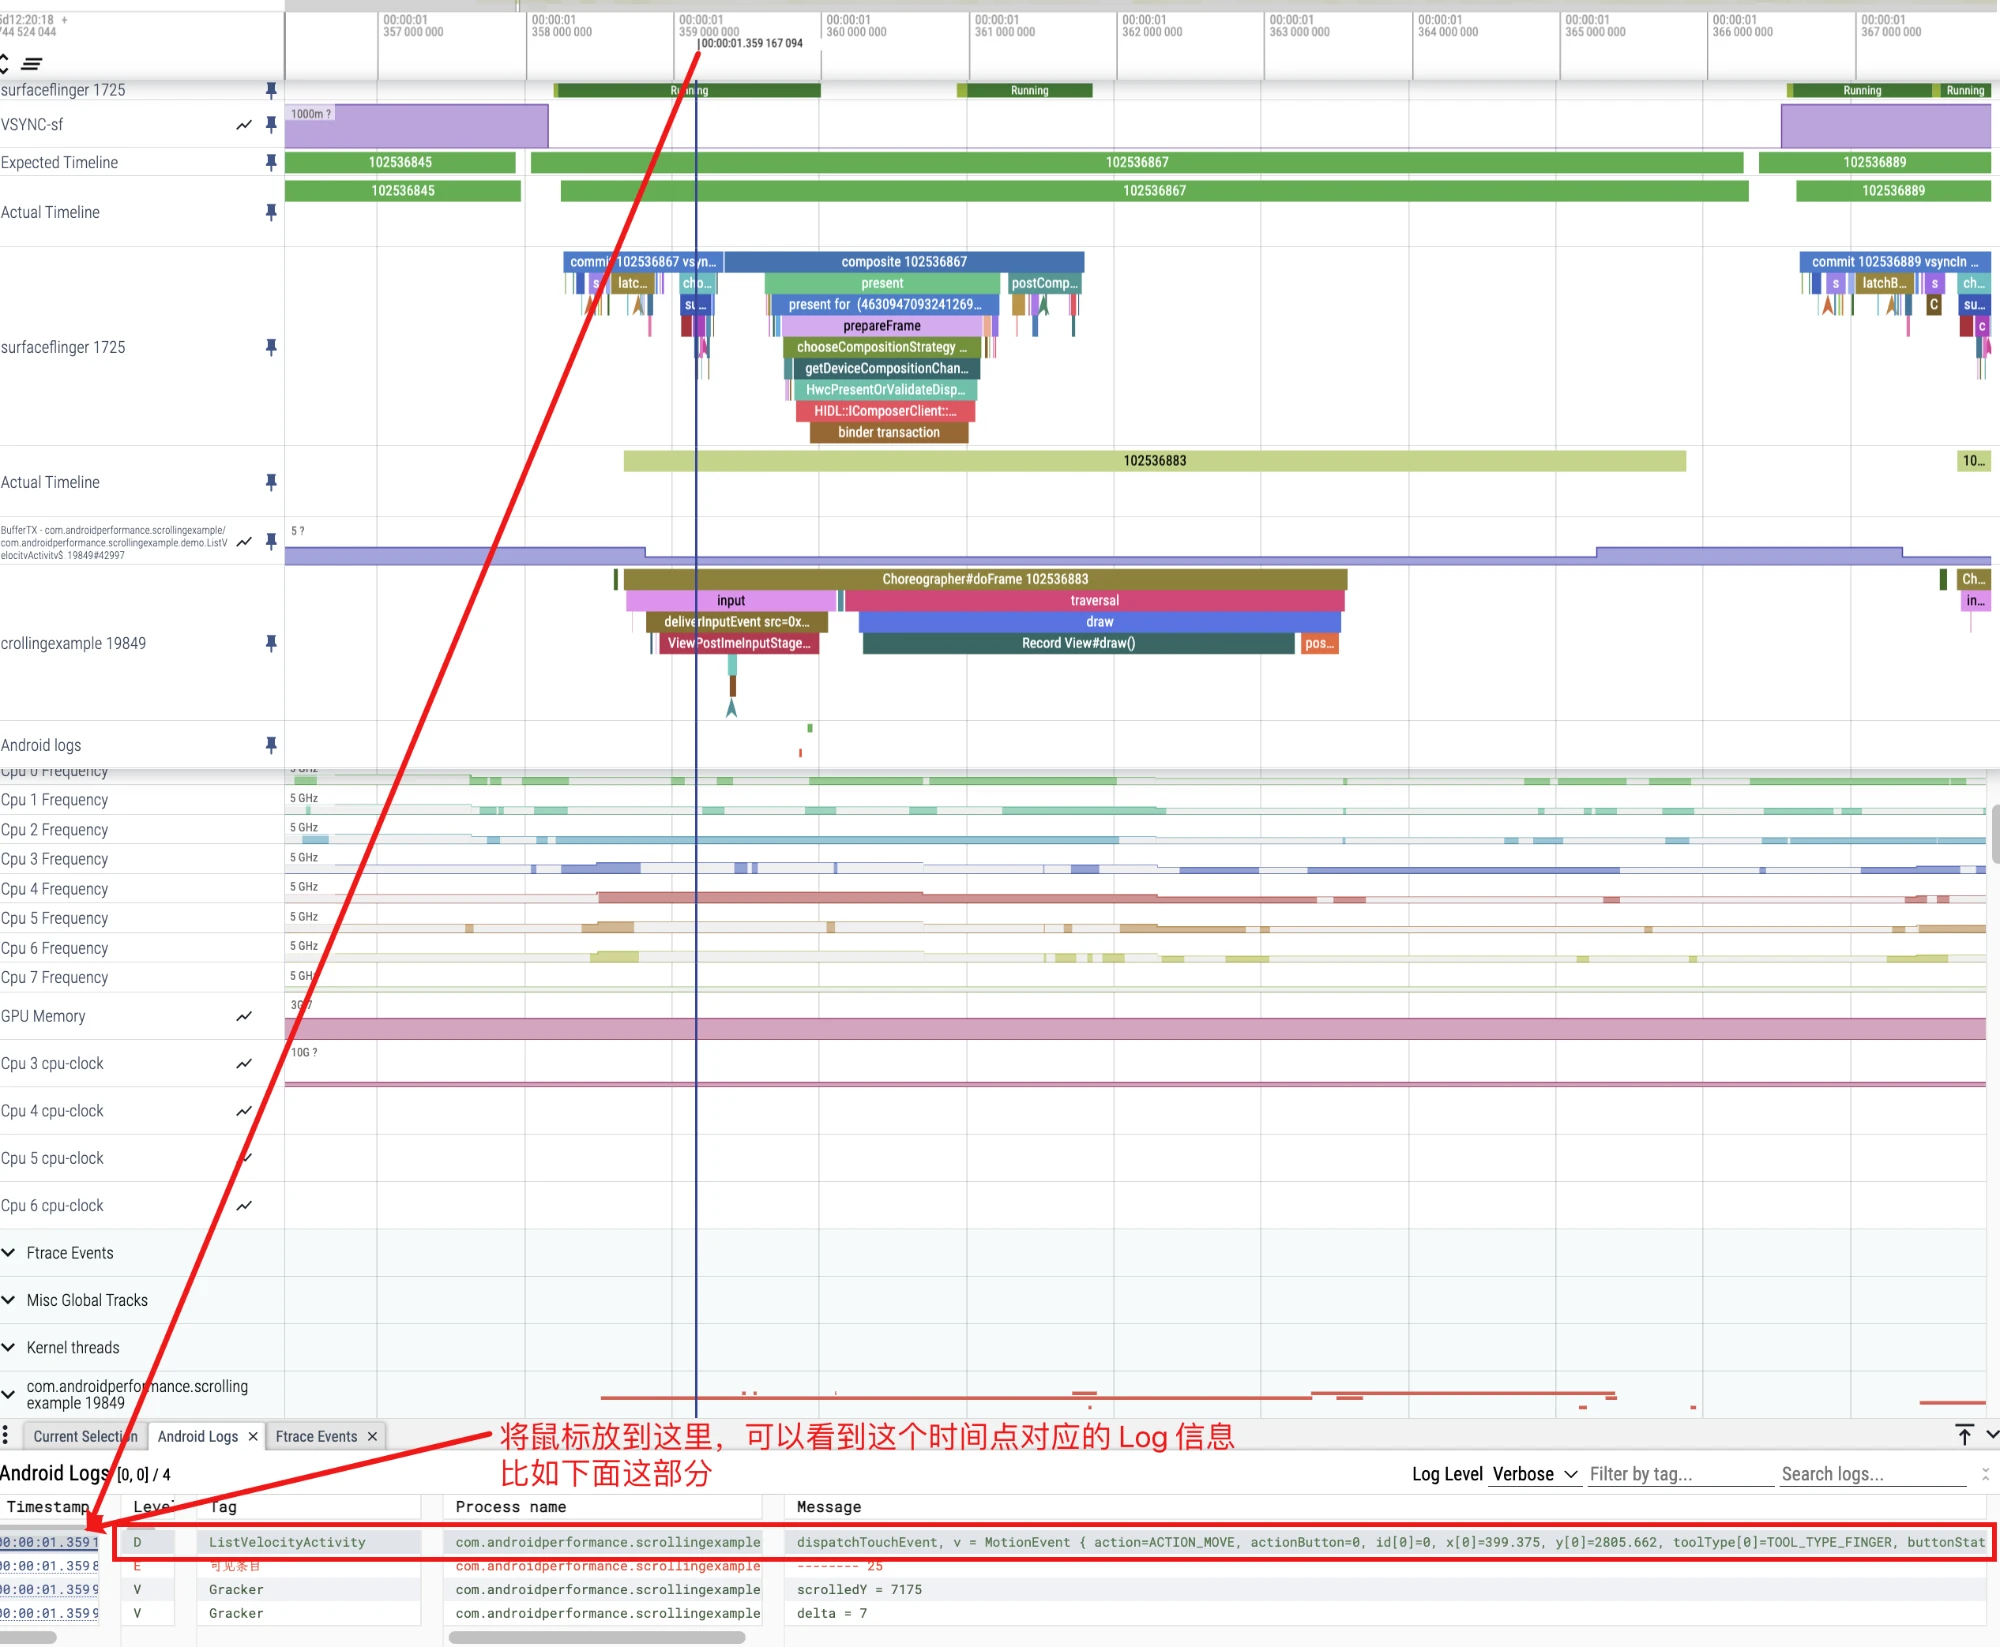
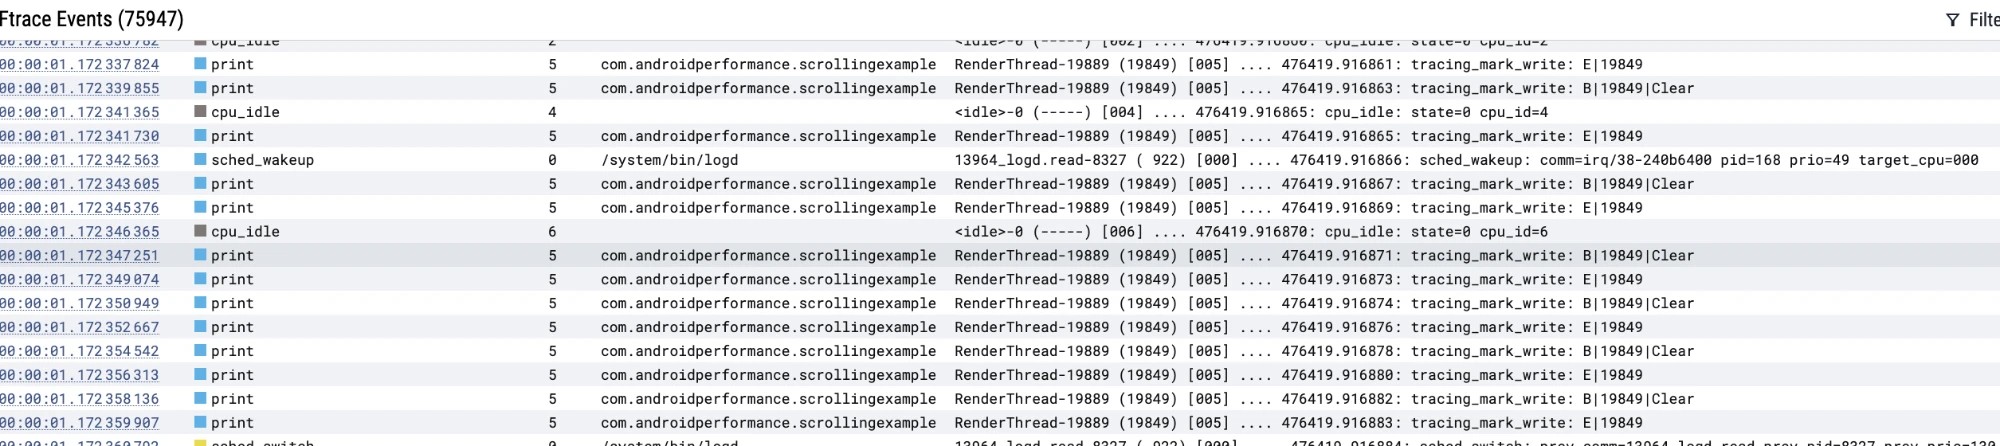
Similarly, switching to the Ftrace events tab allows you to check corresponding ftrace event and corresponding timeline.
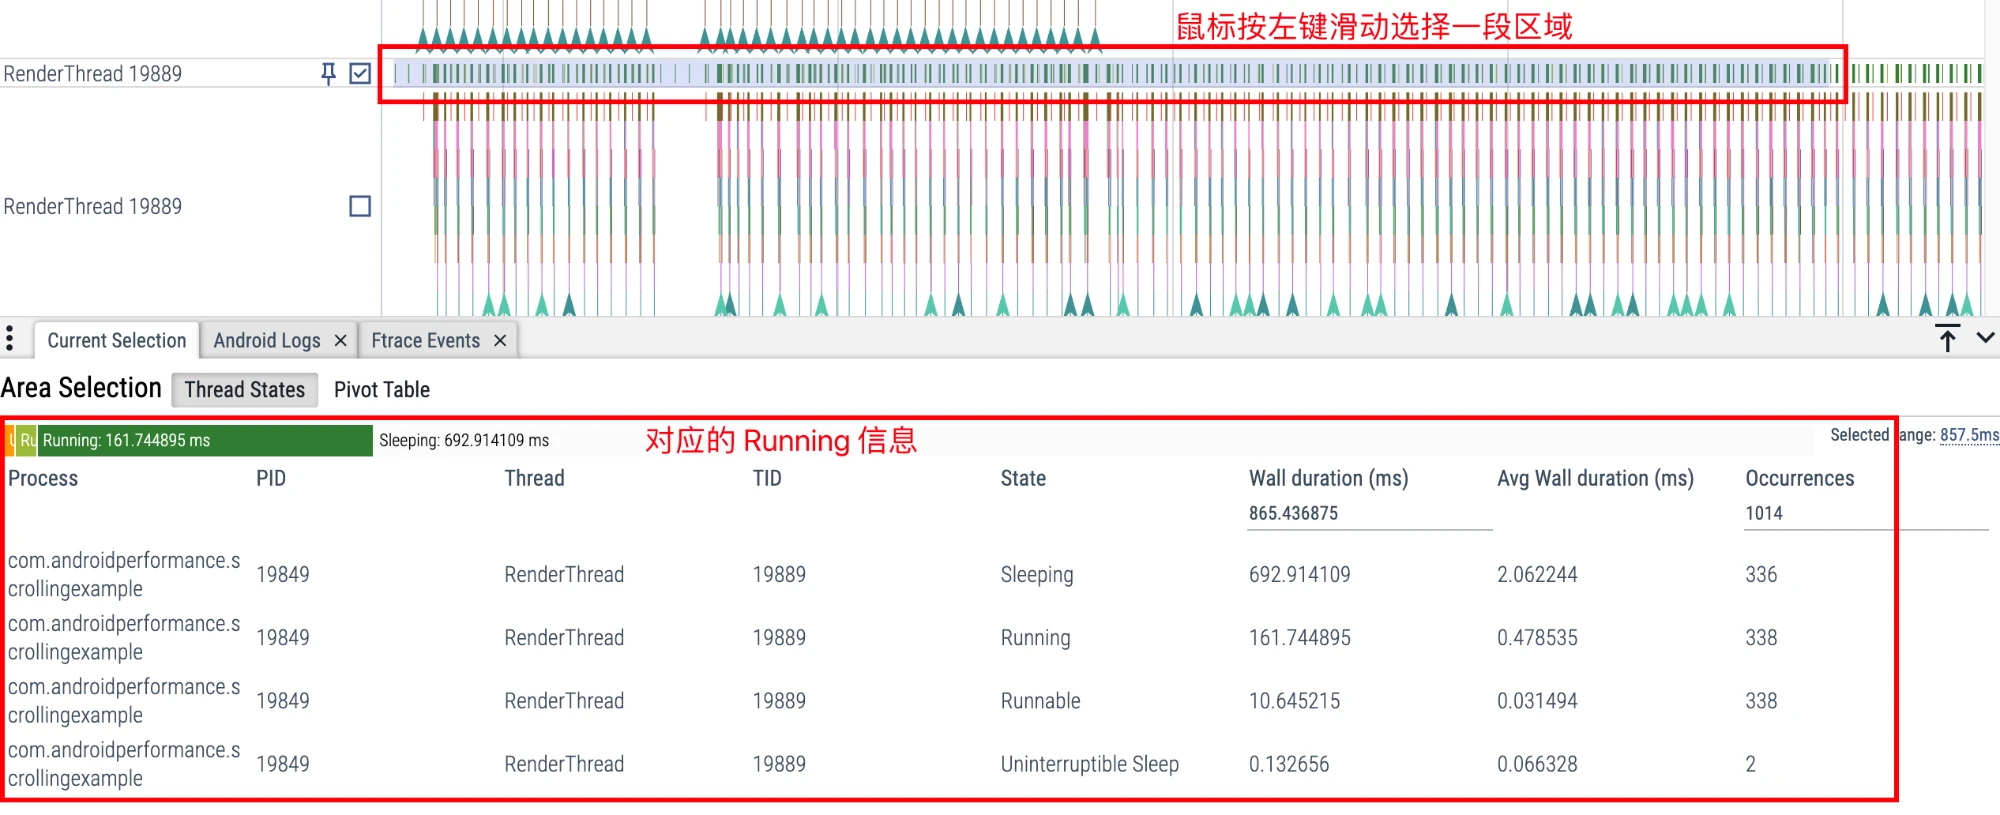
Analyze Running Information of Thread
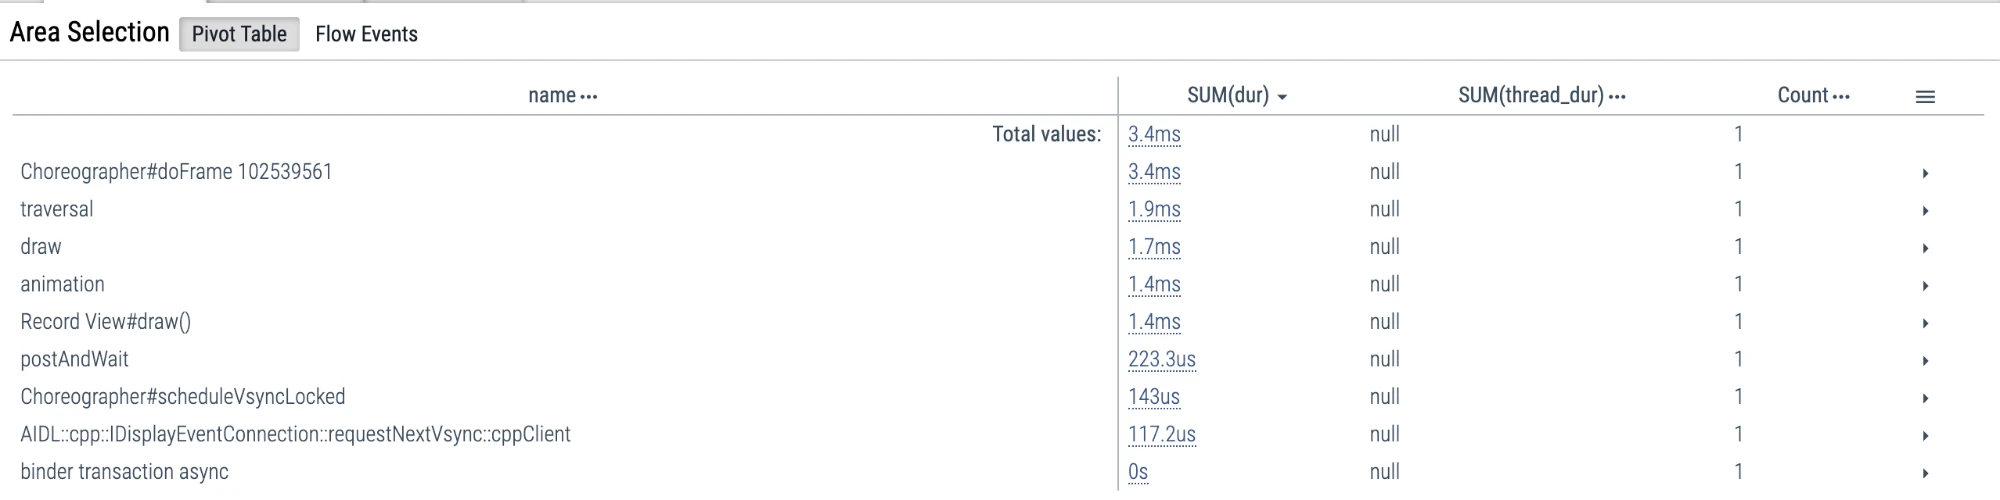
You can select a section of area for analysis by holding down the left mouse button and sliding. For example, if you select the CPU State column, you can see the proportion of Running, Runnable, Sleep, and Uninterruptible Sleep corresponding to this period of time.
This is often used when analyzing App startup.
Summary
The basic interface and operations of Perfetto are shared above, as well as some relatively commonly used Perfetto tips. Google is currently actively promoting and maintaining Perfetto. Many new functions may pop up someday. I will update them if I think they are useful.
The basic chapter of Perfetto ends here. The follow-up is to understand the basic process of Android system operation through the tool Perfetto, and use Perfetto and Perfetto SQL to analyze the problems encountered such as performance and power consumption.
About Me && Blog
Here is a personal introduction and related links. I hope to communicate more with my peers. When three people walk together, there must be one who can be my teacher!
- Blogger Personal Introduction: Contains personal WeChat and WeChat group links.
- This Blog Content Navigation: A navigation of personal blog content.
- Personal Collection of Excellent Blog Articles - Android Performance Optimization Must-Know: Welcome everyone to recommend themselves and others (WeChat private chat is fine)
- Android Performance Optimization Knowledge Planet: Welcome to join, thank you for your support~
One person can go faster, a group of people can go further