This is the first article in the Perfetto series. It mainly provides a brief introduction to the Perfetto tool, including its history, development, and what Perfetto can do.
With Google announcing the deprecation of the Systrace tool and the release of Perfetto, Perfetto has basically replaced Systrace in my daily work. At the same time, major manufacturers like OPPO and Vivo have also switched from Systrace to Perfetto. Many friends who are new to Android performance optimization feel a headache when facing the dazzling interface and complex functions of Perfetto. They hope that I can present those previous Systrace articles using Perfetto.
Table of Contents
- Perfetto Series Catalog
- Main Content
- Why Performance Analysis Needs a God’s View
- Introduction to Perfetto
- Where it’s not as good as Systrace
- Reference Documents
- About Me && Blog
Paul Graham said: “Either give a lot of people something they kind of want, or give a small number of people something they really want.“ Perfetto is actually something that a small number of people really want, so let’s start writing. I welcome everyone to exchange and communicate. If you find errors or inaccurate descriptions, please inform me in time, and I will modify them in time to avoid misleading others.
This series aims to examine the overall operation of the Android system from a new perspective through the tool Perfetto. In addition, it also aims to provide a different angle to learn key modules such as App, Framework, and Linux. Although you may have read many articles about Android Framework, App, and performance optimization, you may still feel confused because it is difficult to remember the code or understand its running process. Through the graphical tool Perfetto, you may gain a deeper understanding.
Perfetto Series Catalog
- Android Perfetto Series Catalog
- Android Perfetto Series 1: Introduction to Perfetto
- Android Perfetto Series 2: Capturing Perfetto Traces
- Android Perfetto Series 3: Familiarizing with the Perfetto View
- Android Perfetto Series 4: Opening Large Traces via Command Line
- Android Perfetto Series 5: Choreographer-based Rendering Flow
- Android Perfetto Series 6: Why 120Hz? Advantages and Challenges
- Android Perfetto Series 7: MainThread and RenderThread Deep Dive
- Android Perfetto Series 8: Understanding Vsync and Performance Analysis
- Android Perfetto Series 9: Interpreting CPU Information
- Android Perfetto Series 10: Binder Scheduling and Lock Contention
- Video (Bilibili) - Android Perfetto Basics and Case Studies
- Video (Bilibili) - Android Perfetto: Trace Graph Types - AOSP, WebView, Flutter + OEM System Optimization
If you haven’t seen the Systrace series yet, here is the portal:
- Systrace Series Catalog: Systematically introduced the use of Systrace, the predecessor of Perfetto, and used Systrace to learn and understand the basic rules of Android performance optimization and Android system operation.
- Personal Blog: Personal blog, mainly content related to Android, and also put some content related to life and work.
Welcome everyone to join the WeChat group or Planet on the About Me page to discuss your problems, the parts about Perfetto you most want to see, and discuss all Android development related content with group friends.
Main Content
I started writing the Systrace series in 2019, and wrote more than 20 articles one after another, from basic usage to the presentation of various modules on Systrace, to practical combat such as startup speed and fluency. It basically met the needs of junior system developers and App developers for the Systrace tool. Through the blog, I also added many like-minded friends, and there are 6 exchange groups just for communication. Thank you all very much for your support.
With Google announcing the deprecation of the Systrace tool and the release of Perfetto, Perfetto has basically replaced Systrace in my daily work. At the same time, major manufacturers like OPPO and Vivo have also switched from Systrace to Perfetto. Many friends who are new to Android performance optimization feel a headache when facing the dazzling interface and complex functions of Perfetto. They hope that I can present those previous Systrace articles using Perfetto.
So there is this series, and I also wrote a few reasons in the Planet why I want to update the Perfetto series (I used to think that the Systrace series was enough):
- Currently, mobile phone manufacturers such as OPPO and Vivo have switched to Perfetto internally. Whether it is capturing Trace or viewing Trace, they are using Perfetto. Many newcomers are exposed to Perfetto instead of Systrace. Keeping the previous old Systrace series will lose this part of the readers.
- The Code corresponding to the previous Systrace series is relatively old. The brand new Perfetto series can use Android 14 Code for updates.
- My personal use of Perfetto is not very deep, and some advanced functions are currently only tasted casually. I can strengthen this part of the content by rewriting the Perfetto series.
- Perfetto is a very powerful tool. Behind it is the entire Android + Linux system. So when writing this series, the focus should be on the Android + Linux behind it, rather than just being limited to the Perfetto tool. Tools are just our way of observing Android + Linux. Understanding the laws of the entire Android system operation, thinking about its operating principles, discovering problems through tools, and thinking about the essence through problems are meaningful to developers.
- Perfetto’s official documentation still does not cover many contents related to Android system operation. I can supplement this part; in addition, the official documentation is in English, and Chinese blogs can supplement this aspect.
- Perfetto can be used as a speech content at Google Dev Best ~.
Paul Graham said: “Either give a lot of people something they kind of want, or give a small number of people something they really want.“ Perfetto is actually something that a small number of people really want, so let’s start writing. I welcome everyone to exchange and communicate. If you find errors or inaccurate descriptions, please inform me in time, and I will modify them in time to avoid misleading others.
Why Performance Analysis Needs a God’s View
Before introducing Perfetto, we need to understand why performance analysis needs tools like Systrace and Perfetto: Taking the Android system as an example, there are many factors affecting performance: the quality of the App itself, the performance of various system modules, the performance of Linux, hardware performance, plus the strategies of various manufacturers, customized functions by manufacturers, the load of the system itself, low memory, heating, differences in various Android versions, user usage habits, etc. The reason cannot be known by analyzing a certain App or a certain module. We need a God’s perspective to look at the operation of the Android system from a higher dimension.
The Perfetto tool provides such a God’s perspective. Through the God’s perspective, we can see various details of the Android system during operation, such as:
- How Input events flow
- How every frame of the App you are using goes from generation to screen display
- Real-time frequency, load, core placement, wake-up of cpu, etc.
- How various Apps in the system are running
- ….
App developers and Android system developers will also add Trace points at important code logic. After turning on some Debug options, very detailed information can be obtained. Even why a Task is placed on a certain cpu will be recorded in detail. Through the info displayed on Perfetto, we can preliminarily analyze the cause of performance problems, and subsequent analysis will be targeted.
Also, to illustrate the complexity of performance optimization, you can look at the description of performance in the book <**System Performance**>, specifically the methodology, which fits the theme of this article very well. I also strongly recommend that all students engaged in performance optimization keep this book as a frequent reading methodology book: System performance engineering is a challenging field due to many reasons, including the fact that system performance is subjective, complex, and often multi-problem.
Performance is Subjective
- Technical disciplines are often objective; too many people in the industry view problems as black and white. When troubleshooting software, determining whether a bug exists or whether a bug is fixed is like this. The appearance of a bug is always accompanied by an error message. The error message is usually easy to interpret, and then you understand why the error appeared.
- Unlike this, performance is often subjective. When starting to address performance issues, the judgment of whether the problem exists may be vague. The same is true when the problem is fixed. Performance considered “bad” by one user may be considered “good” by another user.
The System is Complex
- In addition to subjectivity, performance engineering, as a challenging discipline, is not only because of the complexity of the system, but also because we often lack a clear starting point for analysis regarding performance. Sometimes we just start with guessing, for example, blaming the network, and performance analysis must verify whether this is a correct direction.
- Performance problems may arise from complex interconnections between subsystems, even if these subsystems perform well in isolation. It may also be due to cascading failure, which refers to a faulty component causing performance problems in other components. To understand these problems, you must clarify the relationship between components and understand how they cooperate.
- Bottlenecks are often complex and interconnected in unexpected ways. Fixing a problem may just push the bottleneck to other places in the system, resulting in the overall performance of the system not improving as expected.
- In addition to the complexity of the system, the complex nature of the production environment load may also lead to performance problems. It is difficult to reproduce such situations in a laboratory environment, or they can only be reproduced intermittently.
- Solving complex performance problems often requires a holistic approach. The entire system—including its internal and external interactions—may need to be investigated. This work requires a very wide range of skills, which is generally unlikely to be concentrated in one person, which drives performance engineering to become a varied and intellectually challenging job.
Multiple Problems May Coexist
- Finding a performance problem point is often not the problem itself. In complex software, there are usually multiple problems.
- Another difficulty in performance analysis: the real task is not to find the problem, but to identify the problem or identify which problems are the most important.
- To do this, performance analysis must quantify the importance of the problem. Some performance problems may not apply to your workload or only apply to a very small extent. Ideally, you should not only quantify the problem, but also estimate the speed increase brought by each problem fix. This information is especially useful when management reviews the reasons for engineering or operation and maintenance resource overhead.
- There is an indicator that is very suitable for quantifying performance, that is, latency.
Introduction to Perfetto
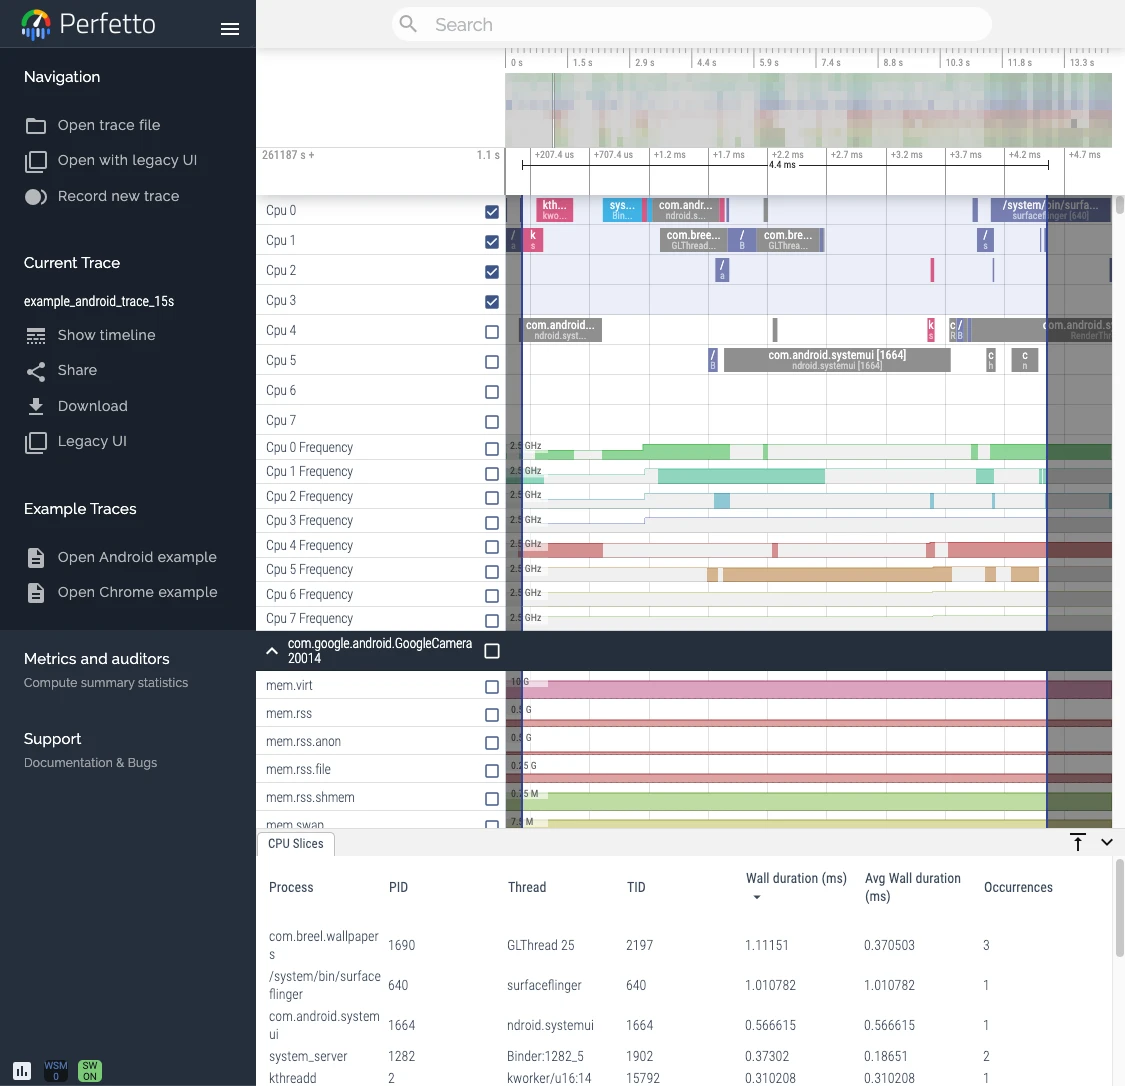
Perfetto is an advanced open-source tool designed for performance monitoring and analysis. It is equipped with a complete set of services and libraries capable of capturing and recording system-level and application-level activity data. In addition, Perfetto also provides memory analysis tools, suitable for both native applications and Java environments. One of its powerful features is that it can analyze trace data through a SQL query library, allowing you to deeply understand the details behind performance data. To better handle and understand large-scale datasets, Perfetto also provides a web-based user interface that allows you to intuitively visualize and explore multi-GB trace files. In short, Perfetto is a comprehensive solution designed to help developers and performance engineers analyze and optimize software performance with unprecedented depth and clarity.
Google started the first submission in 2017. In the following 6 years (as of 2024), a total of more than 100 developers have submitted nearly 37,000 submissions. There are PR and Merge operations almost every day. It is a quite active project. In addition to its powerful functions, its ambition is also very big. The official website claims that it is the next generation of cross-platform Trace/Metric data capture and analysis tools. Usually, it is widely used. In addition to the Perfetto website, Windows Performance Tool and Android Studio, as well as Huawei’s GraphicProfiler also support the visualization and analysis of Perfetto data. We believe that Google will continue to invest resources in the Perfetto project. It can be said that it should be the next generation of performance analysis tools and will completely replace Systrace.
If you are accustomed to using Systrace, switching to Perfetto will be very smooth because Perfetto is fully compatible with Systrace. The Systrace files you captured before can be opened directly in the Perfetto Viewer website. If you have not adapted to Perfetto, you can also open Systrace with one click from Perfetto Viewer.
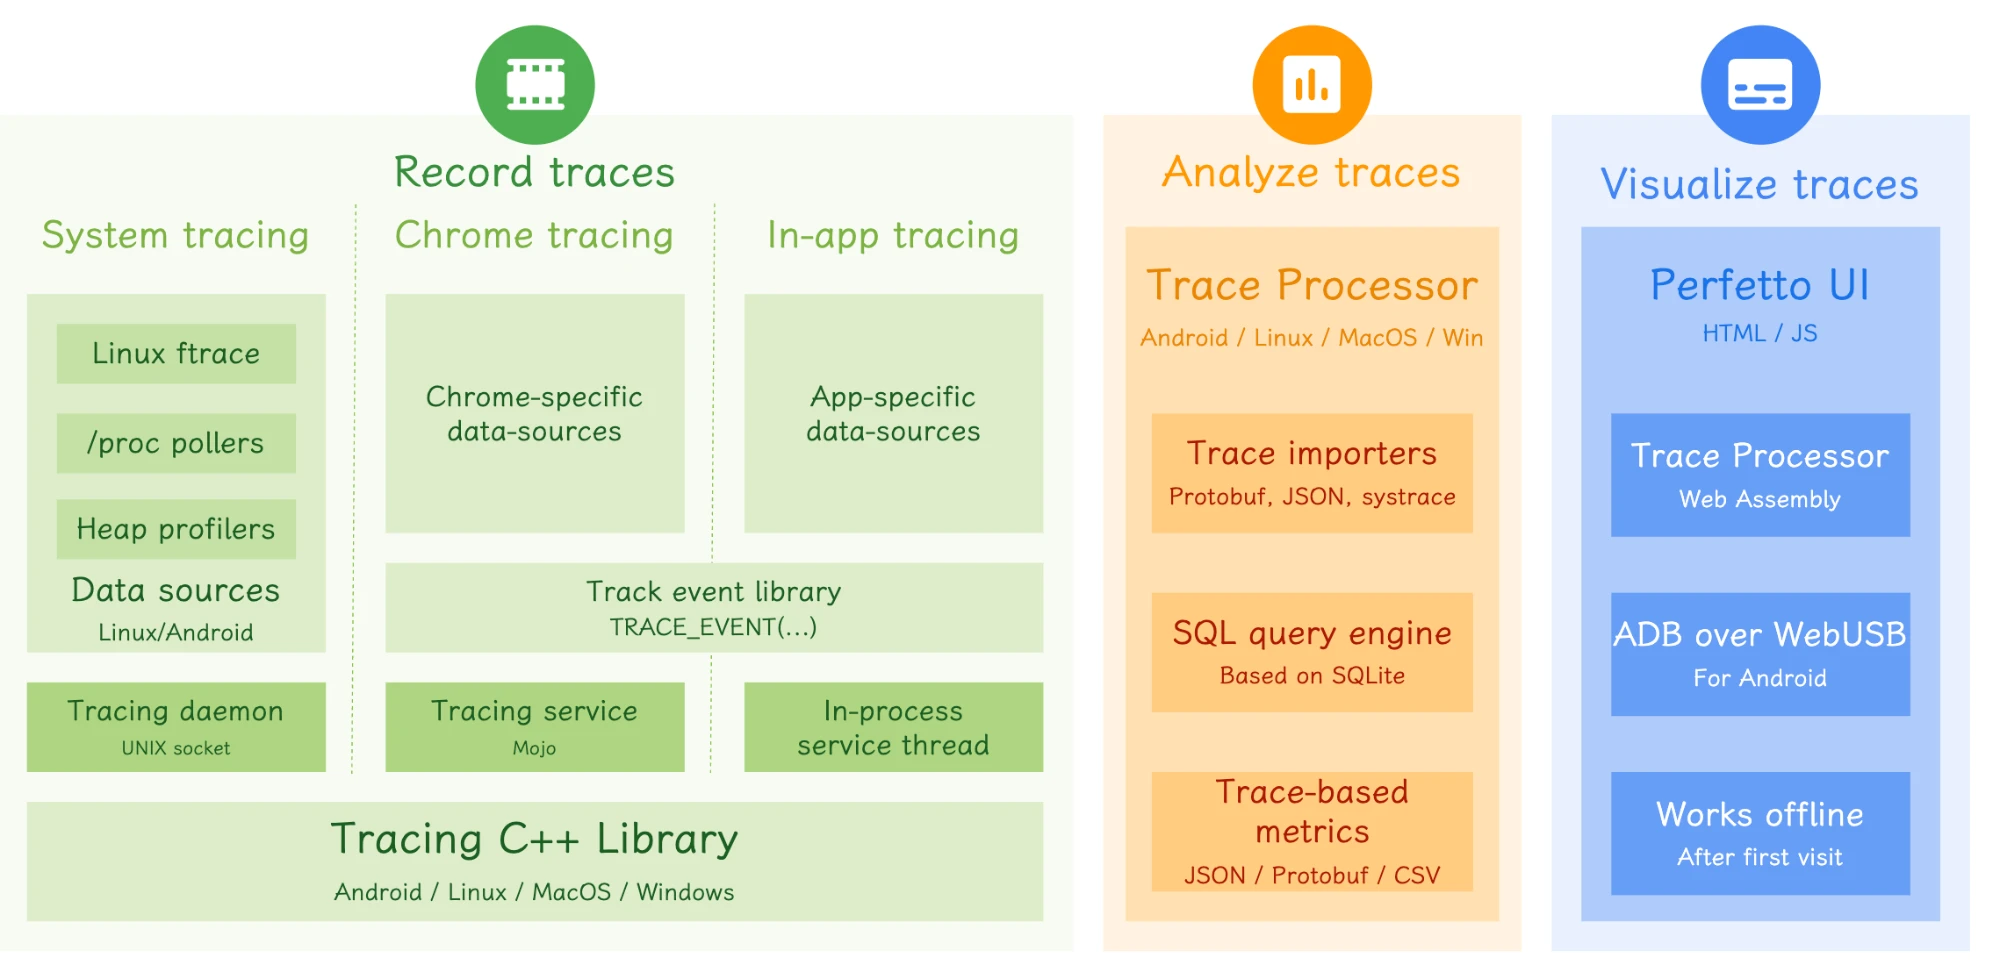
The figure below is the architecture diagram of Perfetto. It can be seen that Perfetto contains three major blocks:
Record traces: The data capture module. It can be seen that the captured content and sources are very rich, involving Java, Native, and Linux, which is much richer than Systrace.
Analyze traces: Mainly the trace analysis module, including Trace parsing, SQL query, Metrics analysis, etc. This part has a dedicated command line tool provided, which is convenient for everyone to call directly or call in the tool chain.
Visualize Traces: Trace presentation, capture, etc.
These modules will be introduced in detail in subsequent articles in the series.
Perfetto’s Core Advantages and Highlights:
Through long-term use and comparison, as well as watching various sharing, here is a summary of Perfetto’s core advantages and functional highlights:
- Support for Long-Term Data Capture:
- Perfetto supports long-time data capture through background services, using Protobuf encoding to store data.
- Data Sources and Compatibility:
- Based on the Linux kernel’s Ftrace mechanism, recording key events in user space and kernel space.
- Compatible with Systrace functions and is expected to eventually replace it.
- Comprehensive Data Support:
- Support Trace, Metric and Log type data.
- Provide multiple data capture methods, including web pages, command line tools, developer options, and Perfetto Trigger API.
- Efficient Data Analysis:
- Provide data visualization web pages, support large file rendering, superior to Systrace.
- Trace files can be converted to SQLite database files, supporting SQL query and script execution.
- Provide Python API, allowing data to be exported to DataFrame format, providing convenience for in-depth analysis.
- Support function call stack display.
- Support memory heap stack display.
- Support pinning the rows you are interested in to the top, without having to scroll up and down all the time (can automatically pin upon opening via script).
- Support visualization of Binder calls and jumps.
- Support very convenient query of wake-up sources.
- Support Visual query of Critical Task.
- Google’s Continuous Updates:
- Google’s tool team is continuously updating Perfetto. Version Release and Bugfix are very timely. You can observe on Github.
Here, I specifically mention SQL. Perfetto can use SQL, which is a huge improvement. When parsing Trace files, many SQL tables and views are built-in, which facilitates querying using SQL statements. For example, the following queries are very practical (Image from Kernel Artisan).
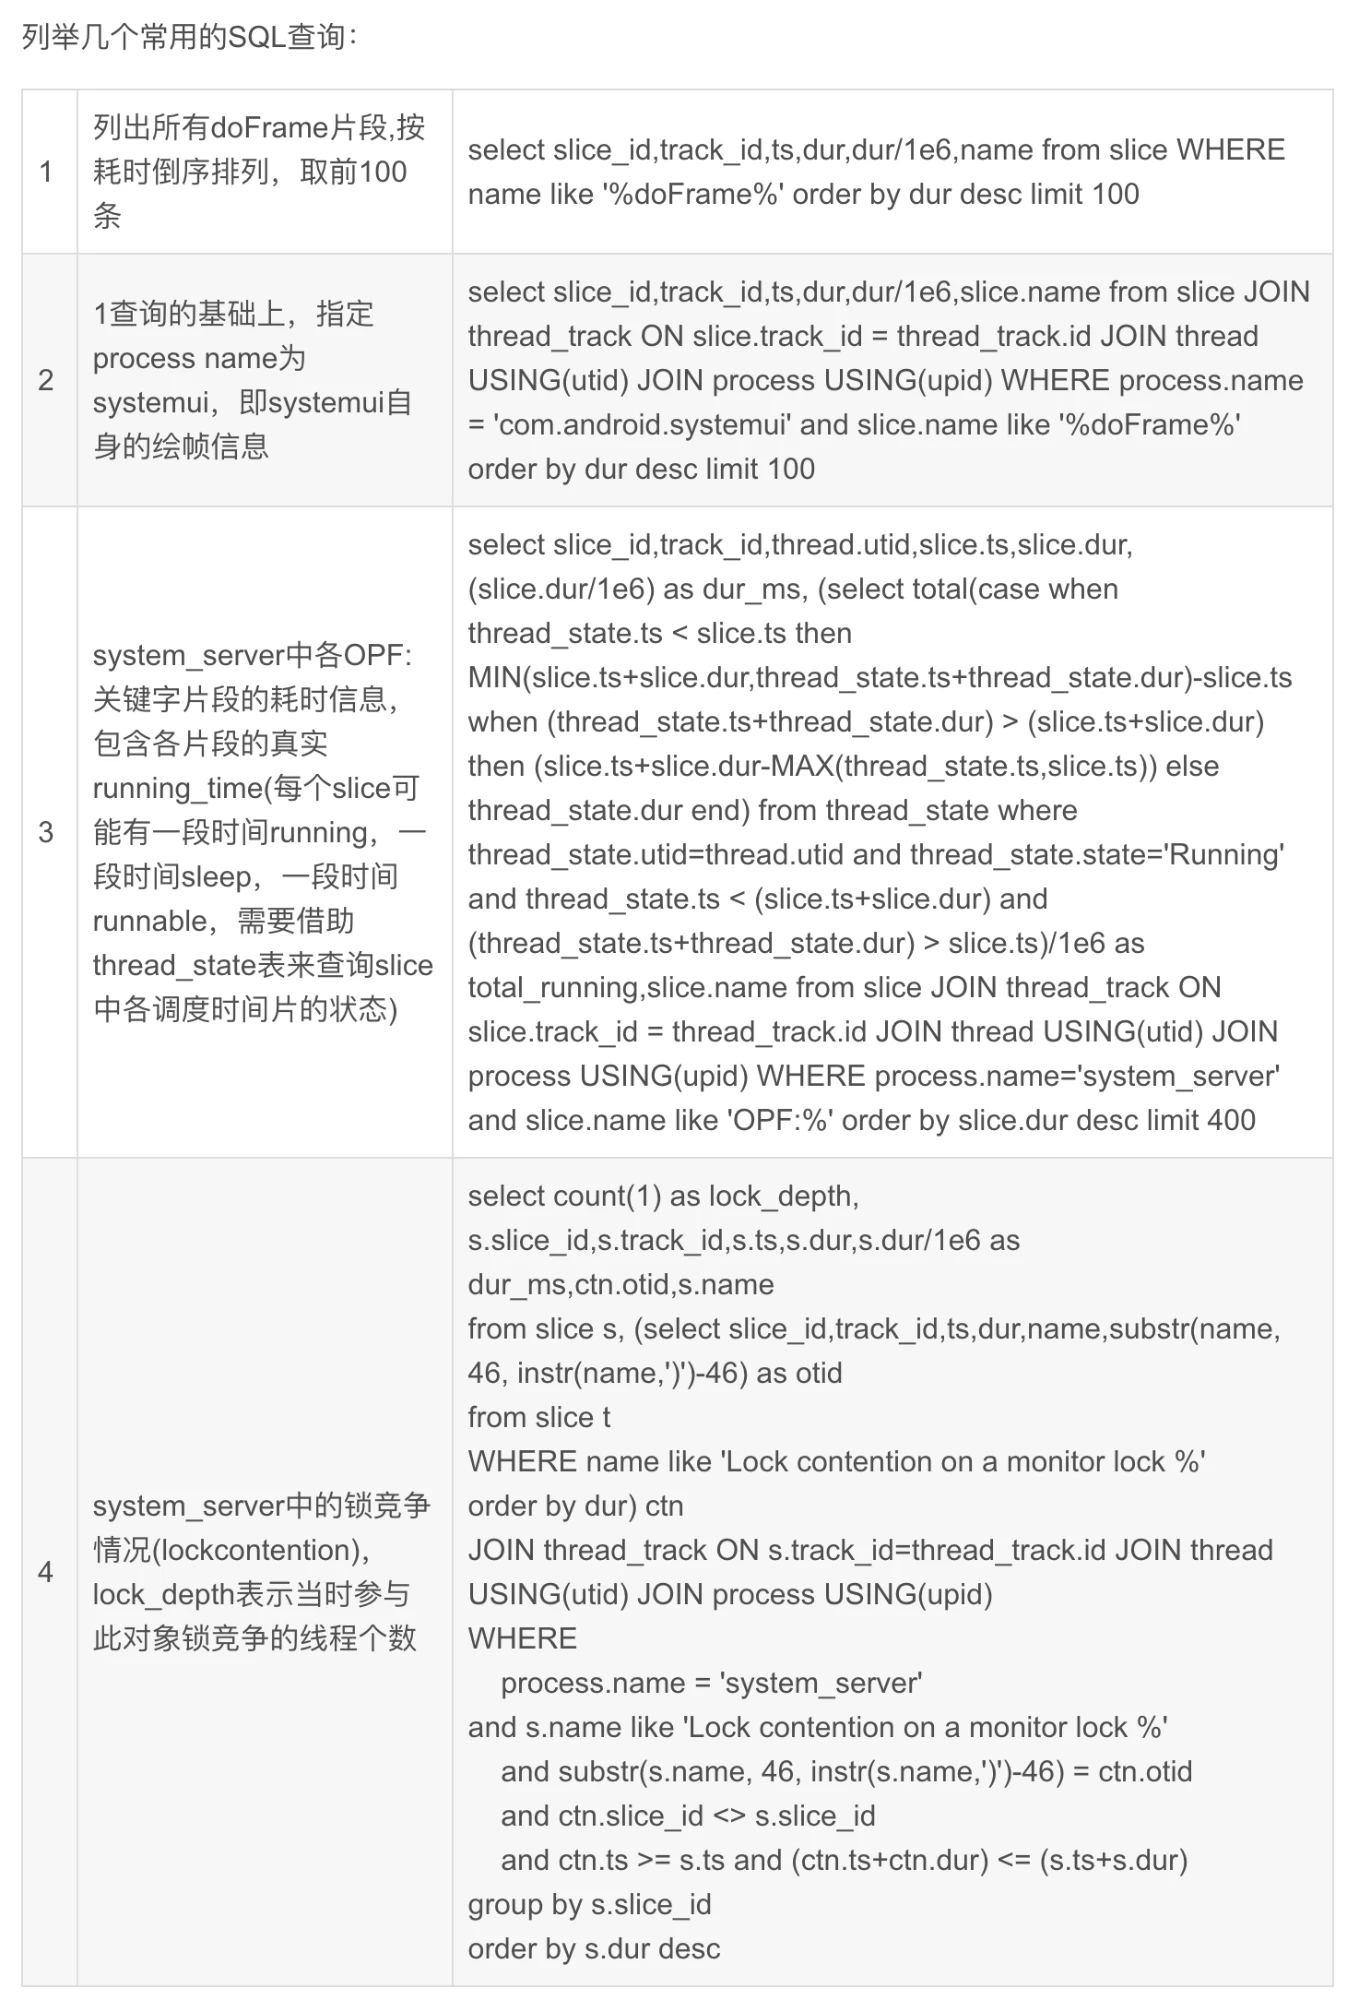
In addition, in its official documentation, when introducing the corresponding part, it will also paste the corresponding SQL and query result examples.
With this, you no longer have to be afraid of your boss saying you have no data. Find it out in minutes with SQL, convert the table to a chart, and a high-quality Report comes out: after optimization, the xxx indicator dropped by xx%, which is really very convenient.
Where it’s not as good as Systrace
Vsync-App is not so intuitive
Vsync-App is relatively less intuitive in Perfetto. For example, if you are used to the vertical line of Vsync-App running through the entire Trace in Systrace, you will feel weird when you look at Perfetto without this:
In Perfetto, you can Pin Vsync-App to the top to see Vsync information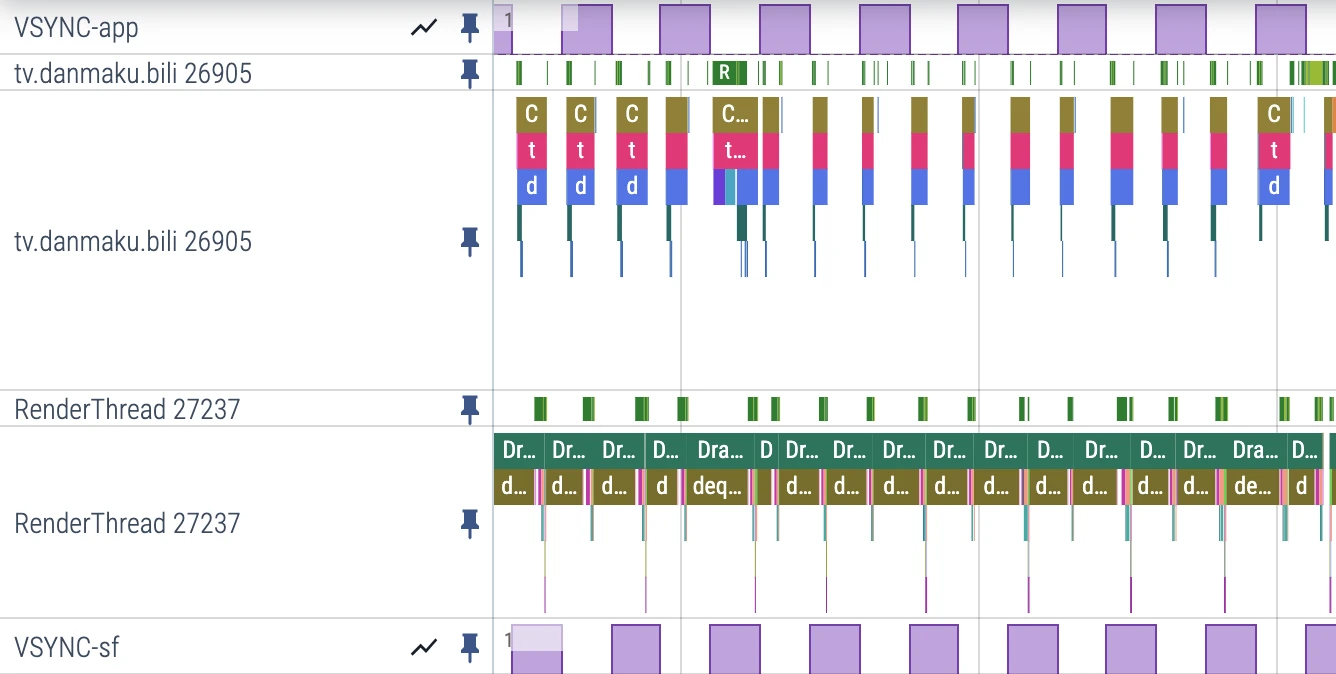
In Systrace, Vsync runs through the entire Trace in the form of a vertical line, which is easy to identify:
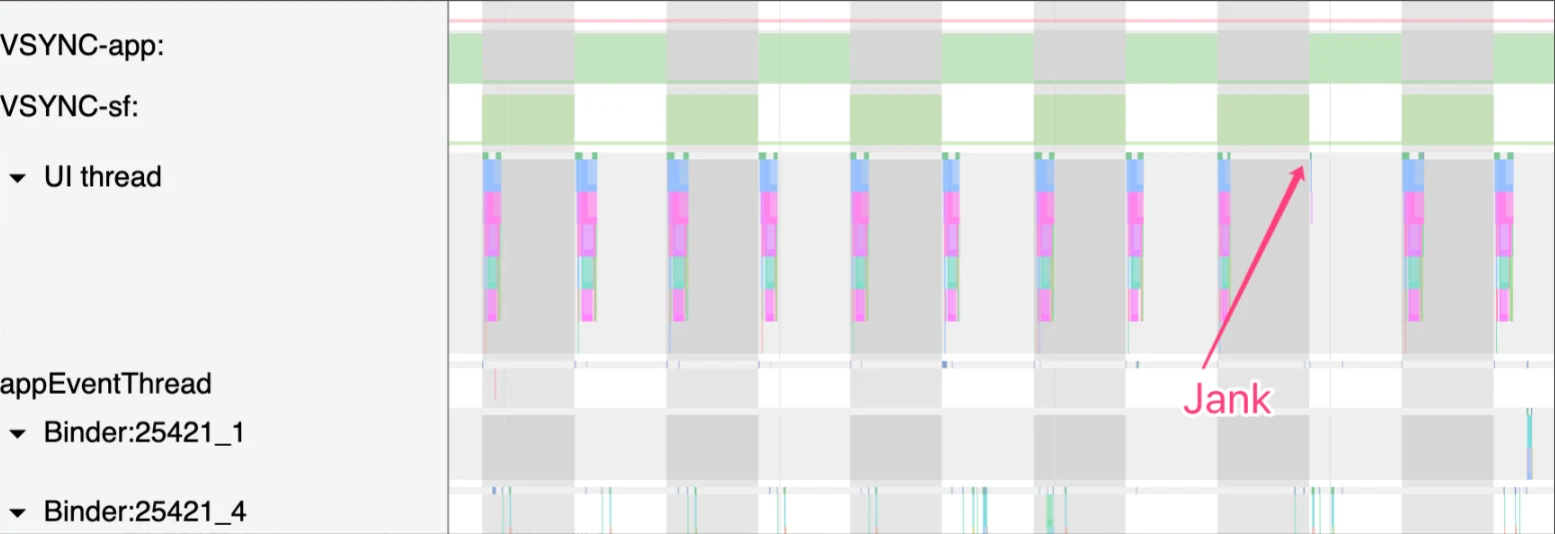
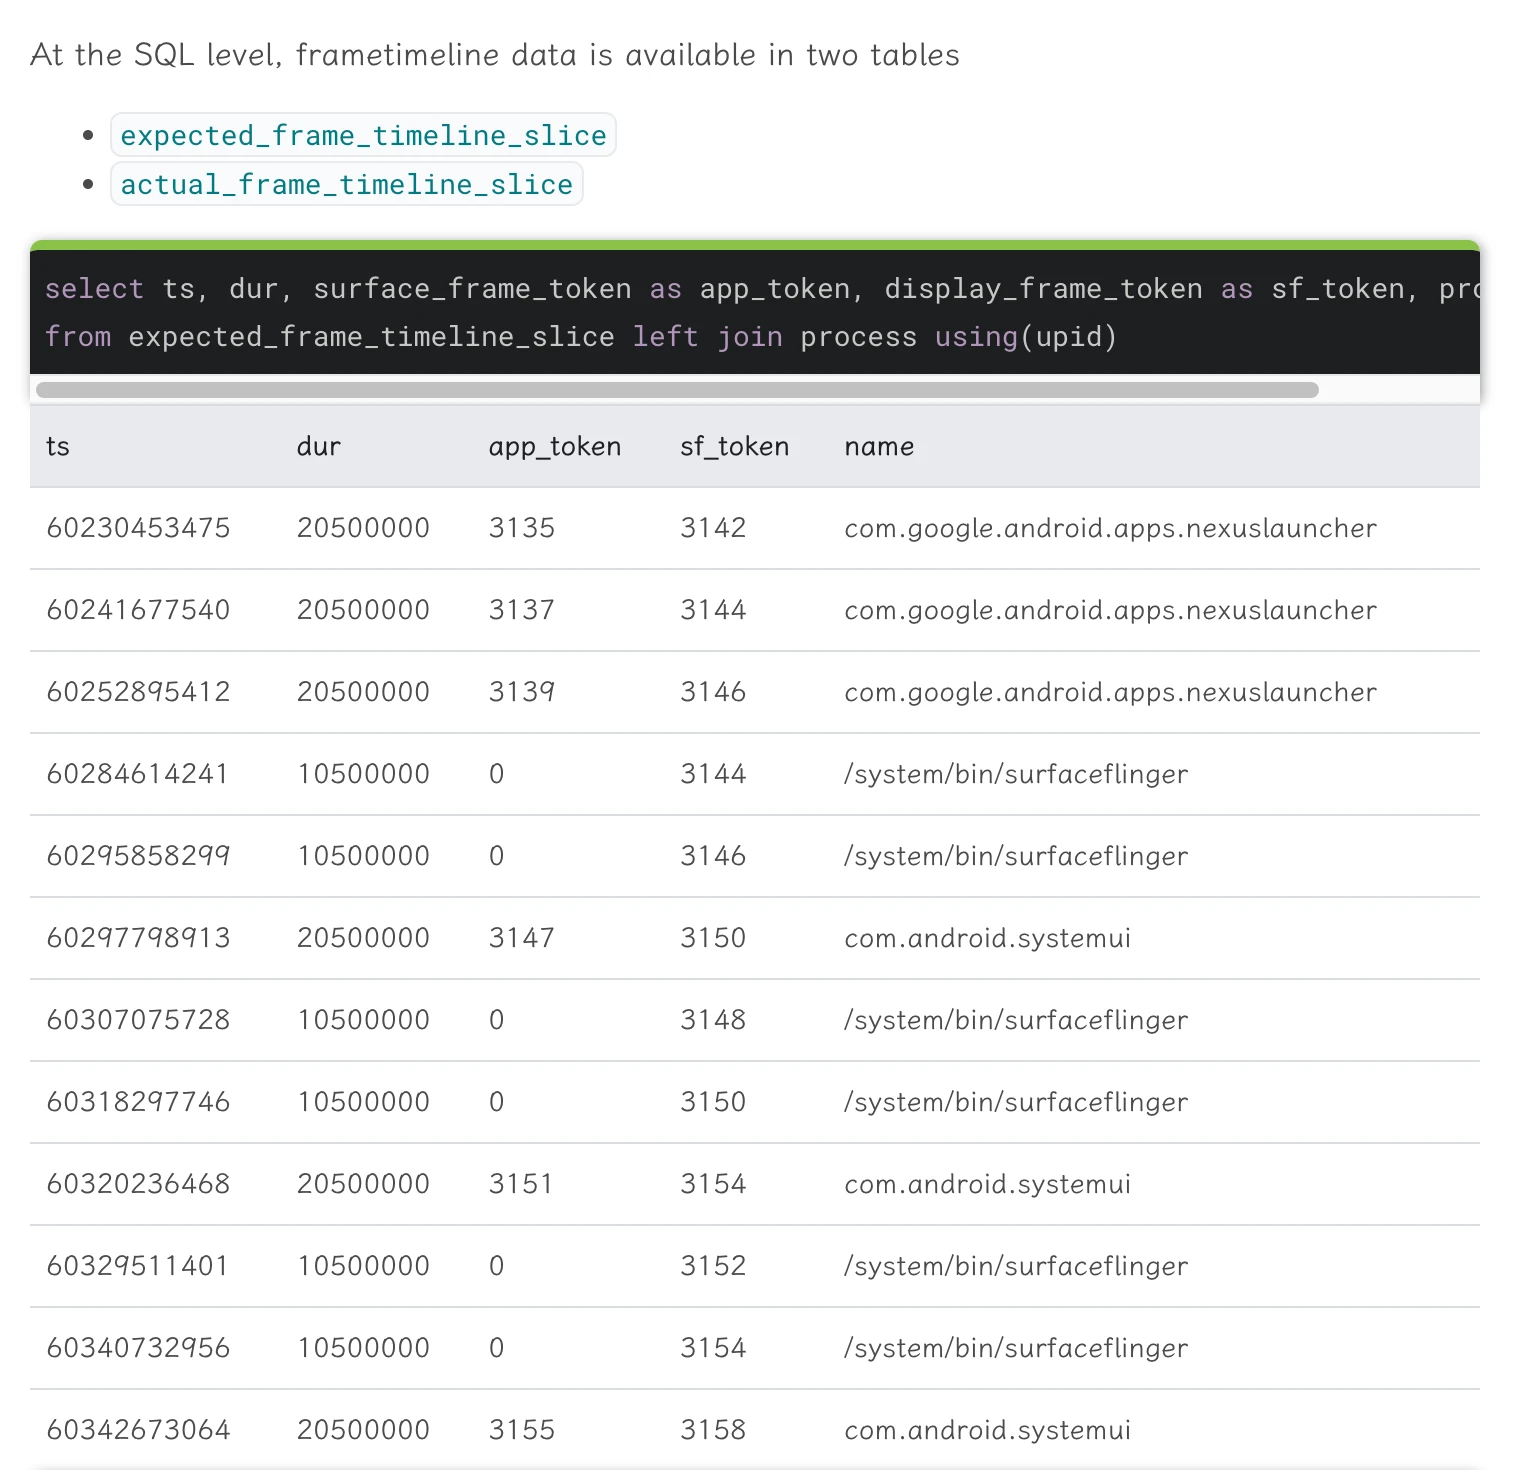
Of course, Perfetto also has reasons for canceling this: Vsync-App actually cannot explain that the App has performance problems. Perfetto uses another way to display it. If you use the Perfetto command to grab the Trace, there will be the following information, recording the Expected Timeline and Actual Timeline of an App frame. Compared with Vsync-App, these two indicators can better explain the problem: Original document
- Expected Timeline: Each slice represents the time the application uses to render the frame. To avoid system stuttering, the application needs to complete within this timeframe. The start time is the time when the Choreographer callback is scheduled.
- Actual Timeline: These slices represent the actual time the application completes the frame (including GPU work) and sends it to SurfaceFlinger for composition. The start time is the time the application starts running. The end time of the slice here represents when the application’s frame is published to SurfaceFlinger.
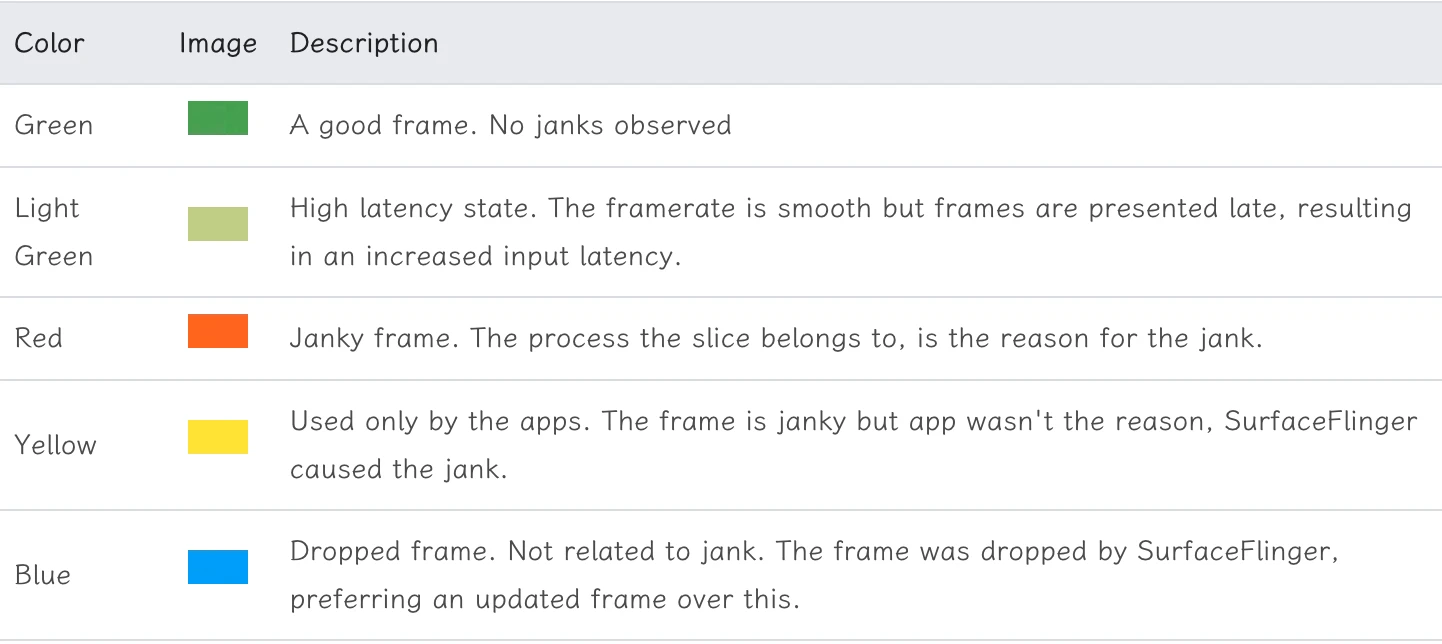
By looking at the difference between Expected Timeline and Actual Timeline, we can quickly locate the point of stuttering (the red marked Actual Timeline frame is the stutter)

Its calculation method is as follows. Looking at the picture, you will know why these two are more accurate (including GPU execution time)
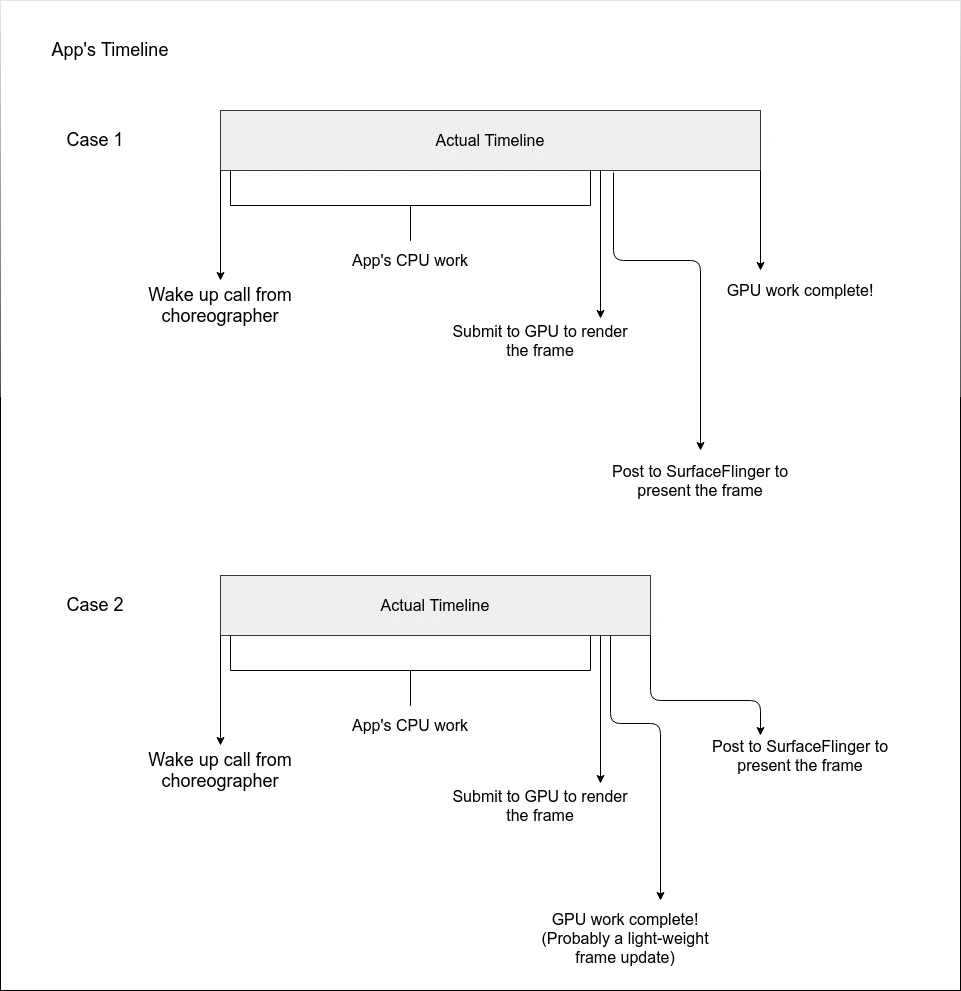
Correspondingly, SurfaceFlinger also has these two indicators.
Folding function is relatively bad, wasteful of screen
If you have a normal widescreen, open Perfetto and randomly Pin a few key threads to the top, the operating space below you is very small. If you encounter a key thread stack that is relatively long, it is even more torturous, and this stack cannot be folded (Systrace can).
Solution:
- Pin fewer key threads (Then what’s the fun)
- Stand the monitor up (Width is discounted)
Finally, we found the perfect solution: switch to LG’s “Rubik’s Cube” screen (DualUp), 16:18, watching Perfetto is simply a perfect match (The office has already been recommended 3 units by me)
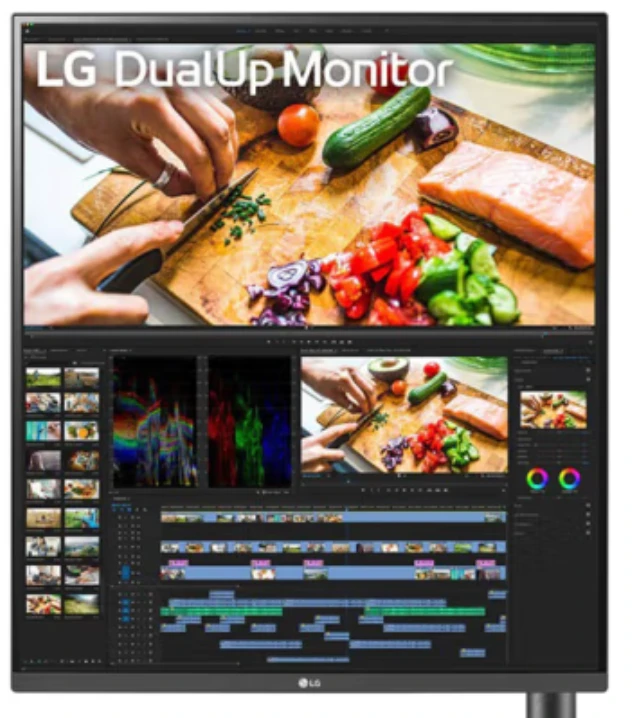
- Not short of money: LG 28MQ780 - 3599
- Flat replacement: Innocn 28C1Q - 2999
Reference Documents
About Me && Blog
Here is a personal introduction and related links. I hope to communicate more with my peers. When three people walk together, there must be one who can be my teacher!
- Blogger Personal Introduction: Contains personal WeChat and WeChat group links.
- This Blog Content Navigation: A navigation of personal blog content.
- Personal Collection of Excellent Blog Articles - Android Performance Optimization Must-Know: Welcome everyone to recommend themselves and others (WeChat private chat is fine)
- Android Performance Optimization Knowledge Planet: Welcome to join, thank you for your support~
One person can go faster, a group of people can go further