This is the first article in the Systrace series, primarily providing a brief introduction to Systrace, its basic usage, how to interpret Systrace traces, and how to analyze phenomena in Systrace in conjunction with other tools.
The purpose of this series is to view the overall operation of the Android system from a different perspective using Systrace, while also providing an alternative angle for learning the Framework. Perhaps you’ve read many articles about the Framework but can never remember the code, or you’re unclear about the execution flow. Maybe from Systrace’s graphical perspective, you can gain a deeper understanding.
Table of Contents
- Perfetto Series Article Index
- Systrace Series Article Index
- Main Content
- Simple Usage of Systrace
- Capturing Systrace with Command-Line Tools
- Viewing Supported TAGs
- About Me && Blog
Perfetto Series Article Index
2025-4-17 Update
- Google has discontinued maintenance for the Systrace tool. If you are new to this, it is recommended to use Perfetto to capture traces. For detailed usage, refer to the Perfetto Series on this blog.
- The latest version of
platform-toolshas removed the Systrace tool. Google recommends using Perfetto to capture traces. If you need the Systrace tool, please download an older version ofplatform-tools. - Choosing between Systrace and Perfetto: My personal recommendation is that you can use both; use whichever feels most comfortable. However, Google eventually plans to replace Systrace with Perfetto, so you might consider switching your default trace viewing tool to Perfetto UI.
- Advantages of Perfetto:
- The most significant improvement of Perfetto over Systrace is its support for long-duration data capture. This is thanks to a background service that encodes collected data into Protobuf format and saves it to disk. In terms of data sources, the core principle is consistent with Systrace—both rely on the Linux kernel’s Ftrace mechanism to record key events in both user and kernel space (ATRACE, CPU scheduling). Perfetto supports all features provided by Systrace, which is why Systrace will eventually be replaced.
- Perfetto’s supported data types, acquisition methods, and analysis techniques are unprecedentedly comprehensive. It supports trace types via ATRACE, metric types through customizable node reading, and log types on UserDebug versions by acquiring
logddata. - You can manually trigger capture and termination through the Perfetto.dev website or command-line tools, trigger long-duration captures via Developer Options in Settings, or even dynamically enable capture using the Perfetto Trigger API provided in the framework. This covers nearly all scenarios encountered in projects.
- On the data analysis side, Perfetto provides a web-based visualization tool similar to Systrace but with a entirely different underlying implementation. The biggest benefit is support for rendering extremely large files—something Systrace cannot do (it may crash or become extremely laggy with files over 300M). This visualization site allows you to see various post-processed data, execute SQL queries, and even view
logcatcontent. Perfetto Trace files can be converted into SQLite-based database files, allowing you to run pre-written SQL files or write queries on the fly. You can even import data into data science stacks like Jupyter and share your analytical insights with colleagues. - For example, if you want to calculate the total CPU consumption of the
SurfaceFlingerthread or identify which threads are running on the large cores, you can collaborate with domain experts to translate their experience into SQL commands. If that’s not enough, Perfetto also provides a Python API to export data into DataFrame format, enabling almost any custom data analysis effect you desire. - You can find introductions to and comparisons of various tools in the article Techniques, Philosophy, and Tools for Android Performance Optimization.
I will continue to update the Perfetto series, and all future illustrations will use Perfetto. The underlying knowledge points are common between Systrace and Perfetto, so don’t worry about which one to use—you can learn from both series.
Perfetto Series Article Index
- Android Perfetto Series Index
- Android Perfetto Series 1: Introduction to Perfetto
- Android Perfetto Series 2: Capturing Perfetto Traces
- Android Perfetto Series 3: Getting Familiar with Perfetto View
- Android Perfetto Series 4: Opening Large Traces Locally Using Command Line
- Android Perfetto Series 5: Android App Rendering Pipeline Based on Choreographer
- Android Perfetto Series 6: Why 120Hz? Advantages and Challenges of High Refresh Rate
- Android Perfetto Series 7 - MainThread and RenderThread Explained
- Android Perfetto Series 8: Deep Dive into Vsync Mechanism and Performance Analysis
- Android Perfetto Series 9 - CPU Information Explained
- Android Perfetto Series 10: Binder Scheduling and Lock Contention
- Video (Bilibili) - Android Perfetto Basics and Case Studies
- Video (Bilibili) - Android Perfetto: Trace Graph Types - AOSP, WebView, Flutter + OEM System Optimization
Systrace Series Article Index
- Introduction to Systrace
- Systrace Basics - Prerequisites for Systrace
- Systrace Basics - Why 60 fps?
- Android Systrace Basics - SystemServer Explained
- Systrace Basics - SurfaceFlinger Explained
- Systrace Basics - Input Explained
- Systrace Basics - Vsync Explained
- Systrace Basics - Vsync-App: Detailed Explanation of Choreographer-Based Rendering Mechanism
- Systrace Basics - MainThread and RenderThread Explained
- Systrace Basics - Binder and Lock Contention Explained
- Systrace Basics - Triple Buffer Explained
- Systrace Basics - CPU Info Explained
- Systrace Smoothness in Action 1: Understanding Jank Principles
- Systrace Smoothness in Action 2: Case Analysis - MIUI Launcher Scroll Jank Analysis
- Systrace Smoothness in Action 3: FAQs During Jank Analysis
- Systrace Responsiveness in Action 1: Understanding Responsiveness Principles
- Systrace Responsiveness in Action 2: Responsiveness Analysis - Using App Startup as an Example
- Systrace Responsiveness in Action 3: Extended Knowledge on Responsiveness
- Systrace Thread CPU State Analysis Tips - Runnable
- Systrace Thread CPU State Analysis Tips - Running
- Systrace Thread CPU State Analysis Tips - Sleep and Uninterruptible Sleep
Main Content
Systrace is a performance data sampling and analysis tool introduced in Android 4.1. It helps developers collect execution information from key Android subsystems (such as SurfaceFlinger, SystemServer, Kernel, Input, Display, and other critical framework modules, services, and the View system), allowing for a more intuitive analysis of system bottlenecks and performance improvements.
Systrace’s capabilities include tracking system I/O operations, kernel workqueues, CPU load, and the health of various Android subsystems. On the Android platform, it’s composed of three main parts:
- Kernel Space: Systrace leverages the
ftracefeature in the Linux Kernel. Therefore, to use Systrace, the relevantftracemodules in the kernel must be enabled. - Data Collection: Android defines a
Traceclass that applications can use to output statistical information toftrace. Additionally, theatraceprogram in Android reads statistical info fromftraceand passes it to data analysis tools. - Data Analysis Tools: Android provides
systrace.py(a Python script located inAndroid SDK directory/platform-tools/systracethat callsatraceinternally) to configure data collection (such as tags, output filename, etc.), collectftracestatistics, and generate a resulting HTML file for user viewing. Essentially, Systrace is a wrapper around the Linux Kernel’sftrace. Applications need to utilize theTraceclass provided by Android to use Systrace.
Official documentation and usage for Systrace can be found here: Systrace
Design Philosophy of Systrace
Key flows in the system (such as Touch operations, Power button presses, scrolling), system mechanisms (input dispatching, View rendering, IPC, process management), and hardware/software status (CPU frequency, CPU scheduling, disk info, memory info) have Log-like info inserted, known as TracePoints (essentially Ftrace info). These TracePoints demonstrate the execution time of core operations and the values of specific variables. The Android system then collects these TracePoints scattered across various processes and writes them into a file. After exporting this file, Systrace parses the data to provide an overview of system operation over a period of time.
Important modules in Android have TracePoints inserted by default, categorized by TraceTag:
- Framework Java-level TracePoints use the
android.os.Traceclass. - Framework Native-level TracePoints use
ATracemacros. - App developers can define custom traces using the
android.os.Traceclass.
Consequently, Systrace can collect and centrally display all information from both upper and lower layers of Android. For Android developers, Systrace’s greatest value is transforming the internal state of the Android system from a black box to a white box. Its global perspective and visualization make it the preferred choice for analyzing complex performance issues.
Practical Applications
Because it contains a wealth of system info, parsed Systrace files are naturally suited for analyzing performance issues in both Android Apps and the system itself. App developers, system developers, and Kernel developers can all use Systrace for performance analysis.
- From a technical standpoint, Systrace covers major performance categories: Responsiveness, Jank/Dropped Frames, and ANR.
- From a user perspective, Systrace can analyze issues including but not limited to:
- App startup speed (cold, hot, and warm start).
- Slow UI navigation or janky transitions.
- Sluggishness in non-navigation actions (toggles, popups, long-presses, selection, etc.).
- Slow screen on/off, power on/off, unlocking, or face recognition.
- List scrolling jank.
- Window animation jank.
- Content loading jank.
- System-wide sluggishness.
- App unresponsiveness (ANR), freezes, or crashes.
When encountering these issues, you can capture a Systrace using various methods, open the parsed file in Chrome, and begin analysis.
Simple Usage of Systrace
Before using Systrace, understand how to use it on various platforms. Given the widespread use of Eclipse and Android Studio, I’ll quote the official usage methods, although the process is the same regardless of the tool:
- Prepare the UI you want to trace on the phone.
- Click to start capturing (or execute the command in the CLI).
- Perform operations on the phone (don’t take too long).
- Once the preset time is up, a
Trace.htmlfile will be generated. Open this file in Chrome for analysis.
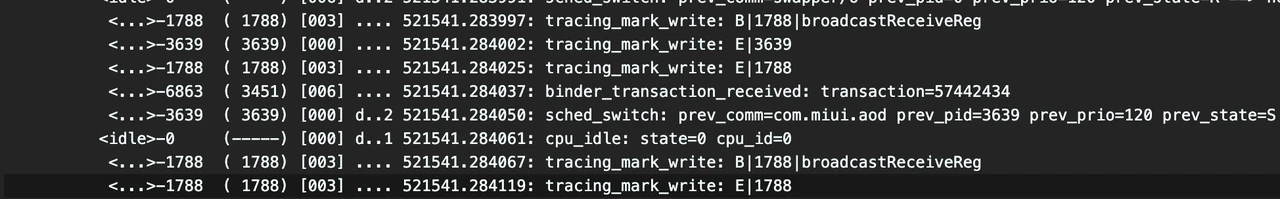
A typically captured Systrace file looks like this: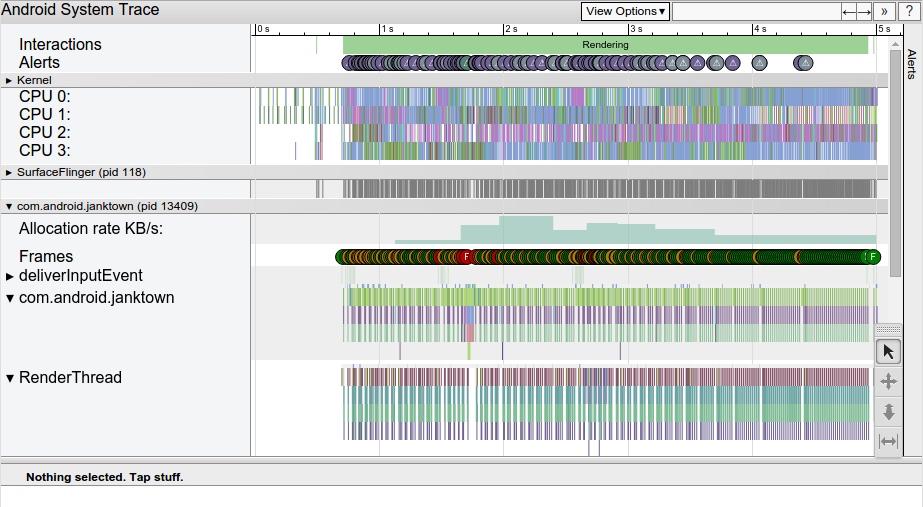
Capturing Systrace with Command-Line Tools
The command-line approach is more flexible and faster. Once configured, you can get results quickly (highly recommended).
The Systrace tool is located in platform-tools within the Android-SDK directory (Note: The latest platform-tools versions have removed the systrace tool. You need to download version 33 or older, available here: https://androidsdkmanager.azurewebsites.net/Platformtools). Below is the basic usage:
1 | $ cd android-sdk/platform-tools/systrace |
Configuring the path and an Alias in your Bash profile can make this very efficient. Also, traces from User builds contain less information than Eng or Userdebug builds. It’s recommended to use a Userdebug device for debugging to ensure both performance and detailed output.
After capturing, a Trace.html file is generated, which must be opened in Chrome. We’ll cover how to analyze the file in later sections. Regardless of the tool used, you can select parameters before capturing. Here’s what they mean:
1 | -a appname enable app-level tracing for a comma separated list of cmdlines; * is a wildcard matching any process |
While there are many parameters, you usually don’t need to worry about most of them when using tools—just check the boxes. In the CLI, we typically alias the command. For example:
1 | alias st-start='python /path-to-sdk/platform-tools/systrace/systrace.py' |
This allows you to simply type st-start to begin. Of course, to distinguish and save files, add -o filename.html. You don’t need to understand every parameter immediately; they will become familiar during the analysis process.
Commonly used parameters:
-o: Specifies the output file path and name.-t: Capture duration (you can press Enter to stop early in newer versions).-b: Specifies the buffer size (default is usually enough; increase it for longer traces).-a: Specifies the app package name (required for debugging custom TracePoints).
Viewing Supported TAGs
The default TAGs supported by Systrace can be viewed with the following command. Different manufacturers may have various configurations; you can choose and configure TAGs based on your needs. Selecting fewer TAGs results in smaller Trace files but less content. Large Trace files can impact Chrome’s performance during analysis, so choose wisely.
Using my Android 12 device as an example, it supports the following tags (tag name on the left, description on the right):
1 | adb shell atrace --list_categories |
About Me && Blog
Below is my personal intro and related links. I look forward to exchanging ideas with fellow professionals. “When three walk together, one can always be my teacher!”
- Blogger Intro: Includes personal WeChat and WeChat group links.
- Blog Content Navigation: A guide for my blog content.
- Curated Excellent Blog Articles - Android Performance Optimization Must-Knows: Welcome to recommend projects/articles.
- Android Performance Optimization Knowledge Planet: Welcome to join and thank you for your support~
One walks faster alone, but a group walks further together.