

In his book Hackers & Painters, Paul Graham asserted, “The disparity in the efficiency of languages is becoming more pronounced, hence the rising importance of profilers. Currently, performance analysis isn’t given the attention it deserves. Many still seem to hold onto the belief that the key to accelerating program execution lies in developing compilers that generate faster code. As the gap between code efficiency and machine performance widens, it will become increasingly apparent that enhancing the execution speed of application software hinges on having a good profiler to guide program development.” by Paul Graham, Hackers & Painters
A Google search for “Android optimization tools” yields an abundance of related content. The issue with these results is that they either contain highly repetitive content or directly explain usage methods. Rarely do they introduce a holistic architecture, inadvertently instilling a misguided belief of “one tool fixes all”. Drawing from the extensive experience of my team, I can assert that in the realm of performance analysis, no such magic bullet tool exists. Tools evolve, old problems re-emerge in new forms, and without mastering core logic, one remains on the technological surface.
This article first systematically untangles the observability technology in performance analysis, encompassing data types, capture methods, and analysis techniques. Subsequently, we introduce the “big three” analysis tools provided by Google. The aim is to impart immutable theoretical knowledge and corresponding tools available in the Android environment to the reader. This wealth of information can facilitate a more direct application of predecessors’ experiences, circumventing unnecessary detours.
It’s crucial to note that there are certainly more than these three tools available for performance optimization. However, these three are our “go-to first-hand tools”. Prior to delving into further analysis, you’ll find yourself dependent on these three tools for bottleneck identification. Subsequent analyses, tailored to distinct domain characteristics, should then leverage corresponding tools.
1 Observability Techniques in Performance Analysis
- Has this operation been executed? How long did it take?
- Why is there a significant difference between two versions?
- What operations is the system executing when CPU usage is high?
- Why has the startup speed slowed down?
- Why does this page always stutter when scrolling?
You’ve likely been asked similar questions by colleagues or bosses more than once. The most primitive idea might be to obtain the relevant logs and analyze them one by one. Based on past experience, one would search for clues by looking for keywords. If the desired information is not available, the next step is to add logs and attempt to reproduce the issue locally. This approach is not only time-consuming and laborious, but also wastes developmental resources. Have you ever wondered if there is a more efficient method in the industry? A method that can improve efficiency by an order of magnitude, allowing us to spend our time solving problems instead of on mundane, repetitive physical tasks?
Of course, there is (otherwise this article wouldn’t exist)—we refer to it as observability techniques.
As the computer industry has evolved, pioneers in computing have devised a category known as “observability techniques.” It involves utilizing tools to observe the intricate details of complex systems’ operations—the more detailed, the better. Mobile operating systems evolved from embedded systems. Nowadays, the computing power of mid-to-high-end Android phones can catch up with a mainframe from two decades ago, and the resulting software complexity is also immense.
Employing a well-designed and smoothly operating observability technique can significantly accelerate software development efficiency. This is because, despite using a variety of preemptive static code detection and manual code reviews, it is impossible to block software issues 100%. Problems only become apparent after the software is run in a real environment, which might be an automated test case of yours. Even then, you still need to sift through your logs and re-read code to identify the problem. For these reasons, every engineering team needs a fully functional observability tool as one of their fundamental infrastructures.
Observability is a systematic engineering effort that allows you to delve deeper into occurrences within the software. It can be used to understand the internal operational processes of software systems (especially complex business logic or interactive systems), troubleshoot, and even optimize the program by identifying bottlenecks. For complex systems, understanding the entire operational process through code reading can be challenging. A more efficient approach is to utilize observability tools to obtain the software’s operational status most intuitively.
We will explore data types, data acquisition methods, and analysis methods to help you understand observability techniques in the sections below.
1.1 Data Types
Logs can be in the form of key-value pairs, JSON, CSV, relational databases, or any other formats. We recreate the entire state of the system at the time it was running through logs to solve a specific issue, observe the operation of a module, or even depict the behavioral patterns of system users. In observability technology, log types are classified into Log, Metric, and Trace types.
Log Type
Logs are the most rudimentary form of data recording, typically noting what happened at what time in which module, whether the log level is a warning or an error. Nearly all systems, whether embedded devices or computers in cars, utilize this form of log. It is the simplest, most direct, and easiest to implement. Almost all Log types are stored as strings, presenting data in lines of text. Logs are the most basic type, and through conversion, can be turned into Metric or Trace types, though the conversion process can become a bottleneck when dealing with massive amounts of data.
Different log types are usually distinguished by error, warning, and debug levels. Naturally, error logs are your primary concern. However, in practice, this classification is not always strict, as many engineers do not differentiate between them, possibly due to a lack of classification analysis for different log levels in their engineering development environment. In summary, you can grade Log types according to your objectives. It acts like an index, enhancing the efficiency of problem analysis and target information location.
Metric Type
Metric types are more focused compared to Log types, recording numerical changes in a particular dimension. Key points are the “dimension” and “numerical change.” Dimensions could be CPU usage, CPU Cluster operation frequency, or context switch counts. Numerical changes can be instant values at the time of sampling (snapshot type), the difference from the previous sampling, or aggregated statistical values over a period. Statistics are often used in practice, such as when wanting to observe the average CPU usage five minutes before an issue occurred. In this case, an arithmetic mean or weighted average calculation of all values within these five minutes is required.
Aggregation is a useful tool because it’s not possible for a person to analyze all Metric values individually. Determining the existence of a problem through aggregation before conducting detailed analysis is a more economical and efficient method.
Another benefit of the Metric type is its fixed content format, allowing data storage through pre-encoding, utilizing space more compactly and occupying less disk space. The most straightforward application is data format storage; Metric types, using integers or floating numbers of fixed byte data, are more space-efficient than Log types, which generally use ASCII encoding.
In addition to specific values, enumeration values can also be stored (to some extent, their essence is numerical). Different enumeration values represent different meanings, possibly indicating on and off statuses, or different event types.
Trace Type
Trace types indicate the time, name, and duration of an event. Relationships among multiple events identify parent-child or sibling connections. Trace types are the most convenient data analysis method when dissecting complex call relationships across multiple threads.
Trace types are particularly suitable for Android application and system-level analysis scenarios because they can diagnose:
- Function call chains
- Binder call chains during invocation
- Cross-process event stream tracing
In the design of Android’s application running environment, an application can’t perform all functionalities independently; it requires extensive interaction with the SystemServer. Communication with the SystemServer is facilitated through Binder, a communication method detailed later in this article. For now, understand that it involves cross-process calling. Accurate restoration of call relationships requires data from both ends, making Trace the optimal information recording method.
You can manually add starting and ending points for Trace types and insert multiple intervals within a function. With pre-compilation technology or language features, Trace intervals can automatically be instrumented at the beginning and end of functions. In an ideal scenario, the latter is the best approach as it allows for understanding what functions are running in the system, their execution conditions, and call relationships. This information can identify the most frequently called (hottest) functions and the most time-consuming ones. Understandably, this method incurs a significant performance loss due to the frequency and magnitude of function calls, especially in complex systems.
An alternative approach involves approximating the above effect by sampling call stacks. Shorter sampling intervals more closely approximate real call relationships and durations, but they can’t be too short, as obtaining stack operations itself becomes a load due to increased frequency. This method, known as a Profiler in the industry, is the basis for most programming language Profiler tools.
1.2 Data Acquisition Methods
Static Code and Dynamic Tracing
Static code collection is the most primitive method. It’s straightforward to implement but requires recompiling and reinstalling the program each time new content is added. If the information you need to diagnose a problem isn’t available, you have no choice but to repeat the entire process. A more advanced approach is to pre-install data collection points at all potential areas of interest, and use dynamic switches to control their output. This technique balances performance impacts and allows dynamic enabling of logs as needed, albeit at a high cost.
Dynamic tracing technology has always been available but is often considered the “holy grail” in the debugging and tracing field due to its steep learning curve. It demands a deep understanding of low-level technologies, especially in areas like compilation, ELF format, the kernel, and programming languages associated with pre-set probes and dynamic tracing. Indeed, dynamic tracing even has its own set of programming languages to cater to the dynamic implementation needs of developers. This approach balances performance and flexibility and enables dynamic retrieval of desired information even in live versions.
In Android application development and system-level development, dynamic tracing is rarely used and is occasionally employed in kernel development. Typically, only specialized performance analysts might utilize these tools. Two critical elements of dynamic tracing are probes and dynamic languages. The program’s execution permission must be handed over to the dynamic tracing framework at specific probe points during runtime. The logic executed by the framework is written by developers using dynamic languages.
Therefore, your program must first have probes. Linux kernel and other frameworks have embedded corresponding probe points, but Android application layers lack these. Currently, dynamic frameworks like eBPF on Android are mainly used by kernel developers.
Unconditional and Conditional Capture
Unconditional capture is straightforward: data is continuously captured after triggering, regardless of any conditions. The drawback is that when the observed object generates a large volume of data, it could significantly impact the system. In such cases, reducing the volume of data captured can mitigate the impact, striking a balance between meeting requirements and minimizing performance loss.
Conditional capture is often employed in scenarios where anomalies can be identified. For instance, capturing logs is triggered when a specific observed value exceeds a pre-set threshold and continues for a certain duration or until another threshold is reached. This method is a slight improvement over unconditional capture as it only impacts the system when an issue arises, leaving it unaffected at other times. However, it requires the capability to identify anomalies, and those anomalies should not necessitate historical data preceding the occurrence. Lowering the threshold can increase the probability of triggering data capture, leading to the same issues faced with unconditional capture, and requiring a balance of performance loss.
Disk Write Strategy
Continuous disk writing involves storing all data captured during the entire data capture process, which can strain storage resources. If the trigger point, such as an anomaly, can be identified, selective disk writing becomes an option. To ensure the validity of historical data, logs are temporarily stored in a RingBuffer and only written to disk upon receiving a disk write command. This method balances performance and storage pressure but at the cost of runtime memory consumption and the accuracy of the trigger.
1.3 Analysis Methods
Data Visualization Analysis
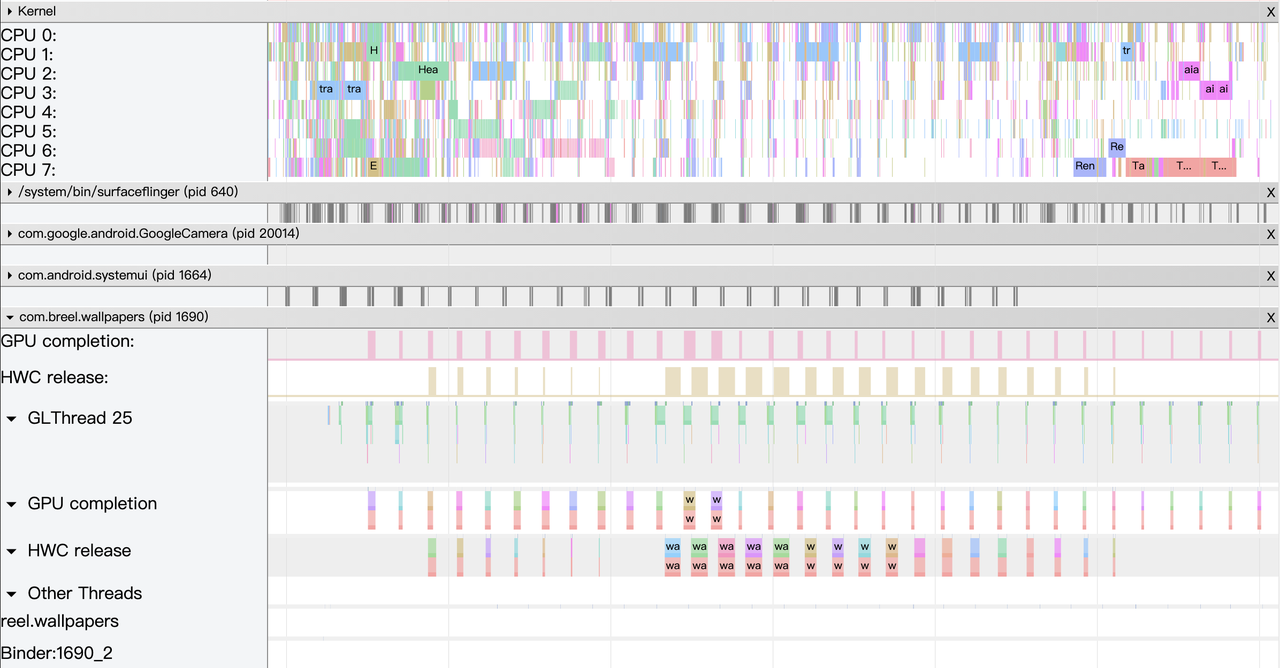
As the complexity of problem analysis increases, especially with the need to address performance issues arising from the interactions among multiple modules, data visualization analysis methods have emerged. These methods visualize events on respective lanes with time as the horizontal axis, facilitating a clear understanding of when specific events occur and their interactions with other systems. In Android, tools like Systrace/Perfetto and, earlier, KernelShark, are fundamentally of this type. The “Trace Type” mentioned in “Data Types” often employs this kind of visualization.
Systrace’s visualization framework is built on a Chrome subproject called Catapult. The Trace Event Format outlines the data formats supported by Catapult. If you have Trace type data, you can use this framework for data visualization. AOSP build systems and the Android app compilation process also output corresponding Trace files, with visualization effects based on Catapult.
Database Analysis
For extensive data analysis, formatting data and converting it into two-dimensional data tables enables efficient query operations using SQL. In the server domain, technology stacks like ELK offer flexible formatted search and statistical functions. With databases and Python, you can even create an automated data diagnostic toolchain.
From the discussion above, it’s evident that text analysis and database analysis serve different analytical purposes. Text analysis is sufficient for evaluating the time consumption of a single module, visualization tools are needed for interactions among multiple systems, and SQL tools are required for complex database analysis. Regardless of the analysis method, the core is data analysis. In practice, we often convert data using other tools to support different analysis methods, such as transitioning from text analysis to database analysis.
Choosing the right analysis method according to your objectives can make your work highly efficient.
For Android developers, Google provides several essential performance analysis tools to assist both system and app developers in optimizing their programs.
2 Google’s Android Performance Analysis Tools
Based on practical experience, the most commonly used tools are Systrace, Perfetto, and the Profiler tool in Android Studio. Only after identifying the main bottlenecks using these tools would you need to resort to other domain-specific tools. Therefore, we will focus on the application scenarios, advantages, and basic usage of these three tools. For a horizontal comparison between the tools, please refer to the content in the next chapter, “Comprehensive Comparison.”
2.1 First Generation System Performance Analysis Tool - Systrace
Systrace is a visualization analysis tool for the Trace type and represents the first generation of system-level performance analysis tools. It supports all the features facilitated by the Trace type. Before the emergence of Perfetto, Systrace was essentially the only performance analysis tool available. It presents the operating information of both the Android system and apps graphically. Compared to logs, Systrace’s graphical representation is more intuitive; and compared to TraceView, the performance overhead of capturing Systrace can be virtually ignored, minimizing the impact of the observer effect to the greatest extent.
Systrace Design Philosophy
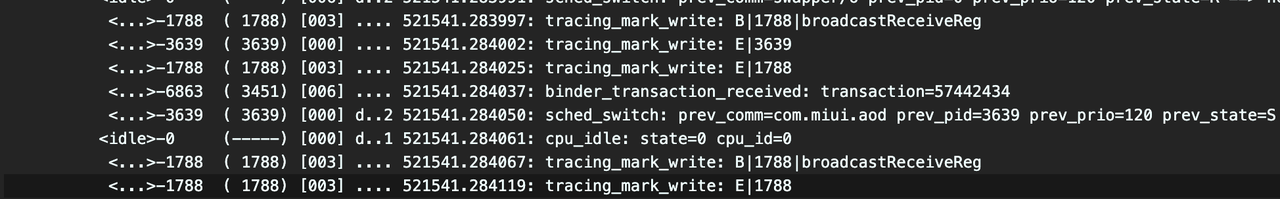
Systrace embeds information similar to logs, known as TracePoints (essentially Ftrace information), at key system operations (such as Touch operations, Power button actions, sliding operations, etc.), system mechanisms (including input distribution, View drawing, inter-process communication, process management mechanisms, etc.), and software and hardware information (covering CPU frequency information, CPU scheduling information, disk information, memory information, etc.). These TracePoints depict the execution time of core operation processes and the values of certain variables. The Android system collects these TracePoints scattered across various processes and writes them into a file. After exporting this file, Systrace analyzes the information from these TracePoints to obtain the system’s operational information over a specific period.
In the Android system, some essential modules have default inserted TracePoints, classified by TraceTag, with information sources as follows:
- TracePoints in the Framework Java layer are implemented through the
android.os.Traceclass. - TracePoints in the Framework Native layer are executed using the ATrace macro.
- App developers can customize Trace through the
android.os.Traceclass.
Consequently, Systrace can collect and display all information from both upper and lower layers of Android. For Android developers, Systrace’s most significant benefit is turning the entire Android system’s operational status from a black box into a white box. Its global nature and visualization make Systrace the first choice for Android developers when analyzing complex performance issues.
Practical Applications
The parsed Systrace, rich in system information, is naturally suited for analyzing the performance issues of both Android Apps and the Android system. Android app developers, system developers, and kernel developers can all use Systrace to diagnose performance problems.
From a Technical Perspective:
Systrace can cover major categories involved in performance, such as response speed, frame drops or janks, and ANR (Application Not Responding) issues.From a User Perspective:
Systrace can analyze various performance issues encountered by users, including but not limited to:- Application Launch Speed Issues: Including cold start, warm start, and hot start.
- Slow Interface Transitions: Including slow transitions and janky animations.
- Slow Non-Transition Click Operations: Such as toggles, pop-ups, long presses, selections, etc.
- Slow Screen Brightness Adjustment Speed: Including slow on/off speed, slow unlocking, slow face recognition, etc.
- List Scrolling Jankiness:
- Window Animation Lag:
- Interface Loading Jankiness:
- Overall System Lag:
- App Unresponsiveness: Including freeze and crash issues.
When encountering the above problems, various methods can be employed to capture Systrace. The parsed file can then be opened in Chrome for analysis.
The ability to trace and visualize these issues makes Systrace an invaluable tool for developers aiming to optimize the performance of Android applications and the system itself. By analyzing the data collected, developers can identify bottlenecks and problematic areas, formulate solutions, and effectively improve the performance and responsiveness of apps and the Android operating system.
2.2 The Next-Generation Performance Analysis Full Stack Tool - Perfetto
Google initiated the first submission in 2017, and over the next four years (up until Dec 2021), over 100 developers made close to 37,000 commits. There are PRs and merges almost daily, marking it as an exceptionally active project. Besides its powerful features, its ambition is significant. The official website claims it to be the next-generation cross-platform tool for Trace/Metric data capture and analysis. Its application is also quite extensive; apart from the Perfetto website, Windows Performance Tool, Android Studio, and Huawei’s GraphicProfiler also support the visualization and analysis of Perfetto data. We believe Google will continue investing resources in the Perfetto project. It is poised to be the next-generation performance analysis tool, wholly replacing Systrace.
Highlighted Features
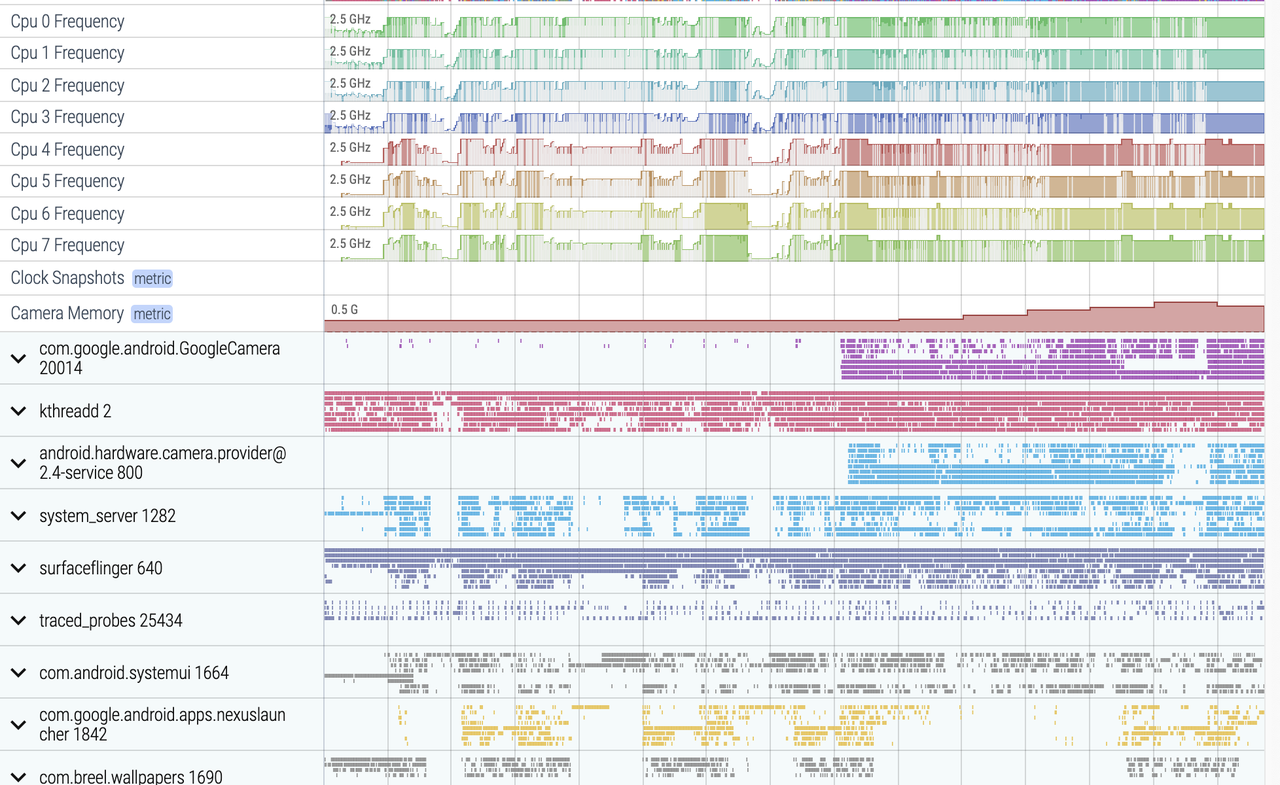
The most significant improvement of Perfetto over Systrace is its ability to support long-duration data capture. This is made possible by a service that runs in the background, enabling the encoding of collected data using Protobuf and saving it to disk. From the perspective of data sourcing, the core principle is consistent with Systrace, both based on the Linux kernel’s Ftrace mechanism for recording key events in both user and kernel spaces (ATRACE, CPU scheduling). Perfetto supports all functionalities provided by Systrace, hence the anticipation of Systrace being replaced by Perfetto entirely.
Perfetto’s support for data types, acquisition methods, and analysis approaches is unprecedentedly comprehensive. It supports virtually all types and methods. ATRACE enables the support for Trace type, a customizable node reading mechanism supports Metric type, and in UserDebug versions, Log type support is realized by obtaining Logd data.
You can manually trigger capture and termination via the Perfetto.dev webpage or command-line tools, initiate long-duration capture via the developer options in the settings, or dynamically start data capture via the Perfetto Trigger API integrated within the framework. This covers all scenarios one might encounter in a project.
In terms of data analysis, Perfetto offers a data visualization analysis webpage similar to Systrace, but with an entirely different underlying implementation. The biggest advantage is its ability to render ultra-large files, a feat Systrace cannot achieve (it might crash or become extremely laggy with files over 300M). On this visualization webpage, one can view various processed data, execute SQL query commands, and even view logcat content. Perfetto Trace files can be converted into SQLite-based database files, enabling on-the-spot SQL execution or running pre-written SQL scripts. You can even import it into data science tool stacks like Jupyter to share your analysis strategies with colleagues.
For example, if you want to calculate the total CPU consumption of the SurfaceFlinger thread, or identify which threads are running on large cores, etc., you can collaborate with domain experts to translate their experiences into SQL commands. If that still does not meet your requirements, Perfetto also offers a Python API, converting data into DataFrame format, enabling virtually any desired data analysis effect.
With all these offerings, developers have abundant aspects to explore. From our team’s practical experience, it can almost cover every aspect from feature development, function testing, CI/CD, to online monitoring and expert systems. In the subsequent series of articles on our planet, we will focus on Perfetto’s powerful features and the expert systems developed based on it, aiding you in pinpointing performance bottlenecks with a single click.
Practical Application
Perfetto has become the primary tool used in performance analysis, with Systrace’s usage dwindling. Hence, the tool you should master first is Perfetto, learning its usage and the metrics it provides.
However, Perfetto has its boundaries. Although it offers high flexibility, it essentially remains a static data collector and not a dynamic tracing tool, fundamentally different from eBPF. The runtime cost is relatively high because it involves converting Ftrace data to Perfetto data on the mobile device. Lastly, it doesn’t offer text analysis methods; additional analyses can only be performed via webpage visualization or operating SQLite. In summary, Perfetto is powerful, covering almost every aspect of observability technology, but also has a relatively high learning curve. The knowledge points worth exploring and learning are plentiful, and we will focus on this part in our upcoming articles.
2.3 Android Studio Profiler Tool
The integrated development environment for Android application development (officially recommended) is Android Studio (previously it was Eclipse, but that has been phased out). It naturally needs to integrate development and performance optimization. Fortunately, with the iterations and evolution of Android Studio, it now has its own performance analysis tool, Android Profiler. This is a collective tool integrating several performance analysis utilities, allowing developers to optimize performance without downloading additional tools while developing applications in Android Studio.
Currently, Android Studio Profiler has integrated four types of performance analysis tools: CPU, Memory, Network, and Battery. The CPU-related performance analysis tool is the CPU Profiler, the star of this chapter. It integrates all CPU-related performance analysis tools, allowing developers to choose based on their needs. Many people might know that Google has developed some independent CPU performance analysis tools, like Perfetto, Simpleperf, and Java Method Trace. CPU Profiler does not reinvent the wheel; it gathers data from these known tools and parses it into a desired style, presenting it through a unified interface.
Highlighted Features
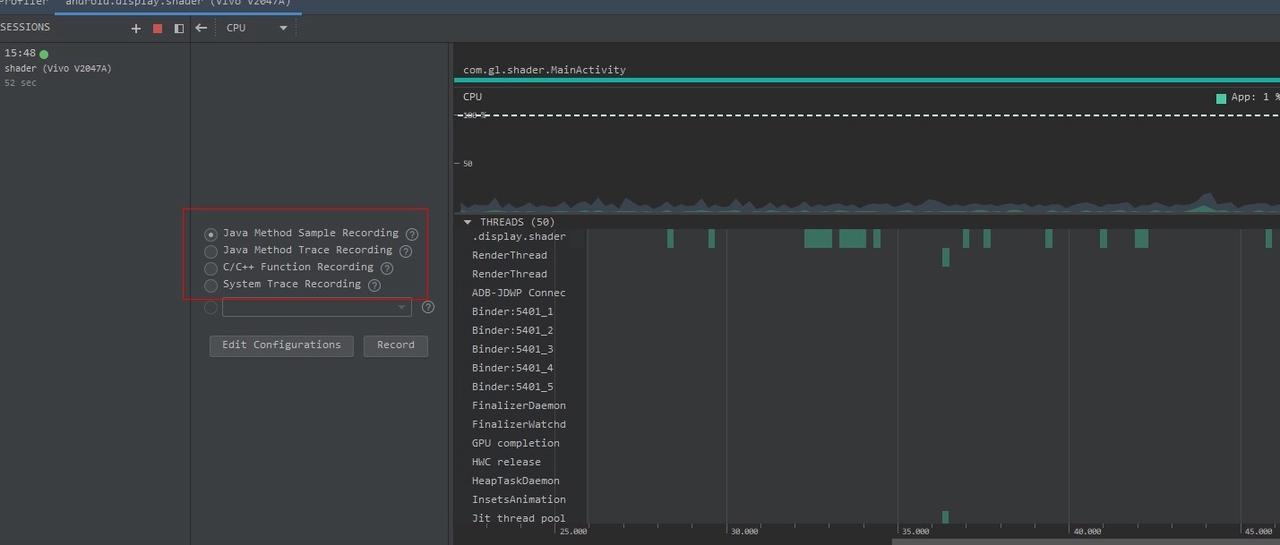
CPU Profiler integrates performance analysis tools: Perfetto, Simpleperf, and Java Method Trace. It naturally possesses all or part of the functionalities of these tools, such as:
- System Trace Recording: Information captured with Perfetto, useful for analyzing process function duration, scheduling, rendering, etc. However, it’s a simplified version, only displaying process-strongly related information and filtering out short-duration events. It’s recommended to export the Trace file for analysis on https://ui.perfetto.dev/.
- Java Method Trace Recording: It gathers function call stack information from the virtual machine, used for analyzing Java function calls and duration.
- C/C++ Function Trace: Information captured with Simpleperf. Simpleperf gathers data from the CPU’s performance monitoring unit (PMU) hardware component. C/C++ Method Trace has only partial functionalities of Simpleperf, used for analyzing C/C++ function calls and durations.
Practical Application
Application performance issues are mainly divided into two categories: slow response and lack of smoothness.
- Slow response issues include slow app startup, slow page transitions, slow list loading, slow button responses, etc.
- Lack of smoothness issues include unsmooth list scrolling, page sliding not following hand movements, animation judders, etc.
How to use CPU Profiler in these scenarios? The basic approach is to capture a System Trace first, analyze and locate the issue with System Trace. If the issue can’t be pinpointed, further analysis and location should be done with Java Method Trace or C/C++ Function Trace.
Taking an extremely poor-performing application as an example, suppose Systrace TracePoint is inserted at the system’s critical positions and the code is unfamiliar. How do you identify the performance bottleneck? First, run the application and record a System Trace with CPU Profiler (the tool usage will be introduced in later articles), as shown below:
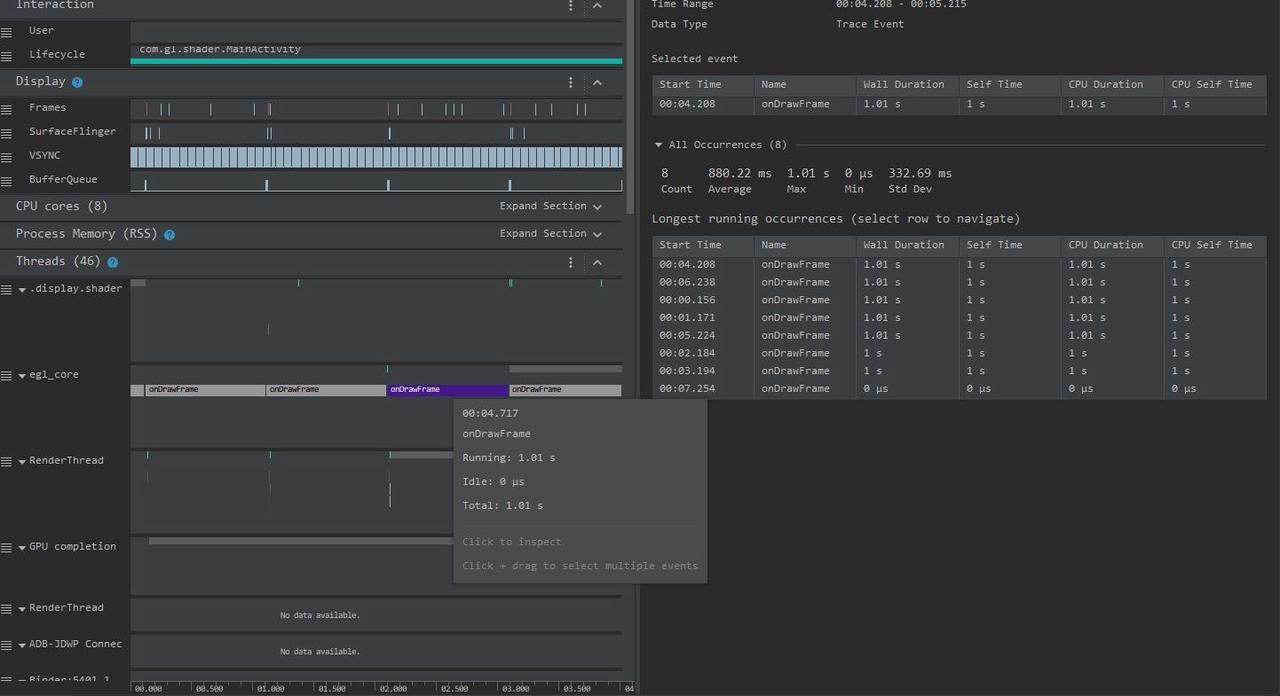
From the above Trace, it’s evident that the onDrawFrame operation in the egl_core thread is time-consuming. If the issue isn’t apparent, it’s advised to export it to https://ui.perfetto.dev/ for further analysis. By looking into the source code, we find that onDrawFrame is the duration of the Java function onDrawFrame. To analyze the duration of the Java function, we need to record a Java Method Trace, as follows:
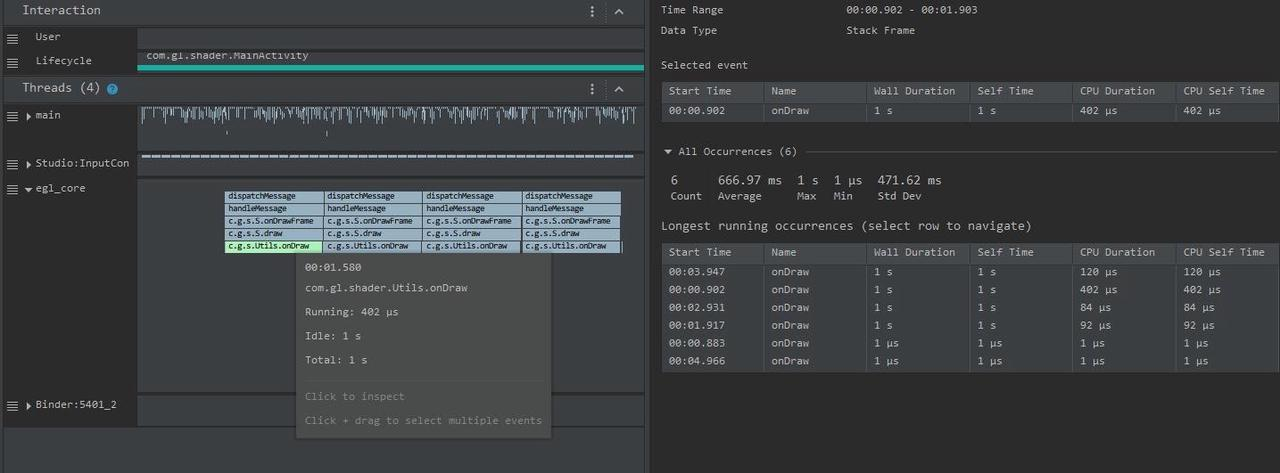
From the above Trace, it’s easy to see that a native function called Utils.onDraw is time-consuming. Because it involves C/C++ code, another C/C++ Function Trace needs to be recorded for further analysis, as shown below:
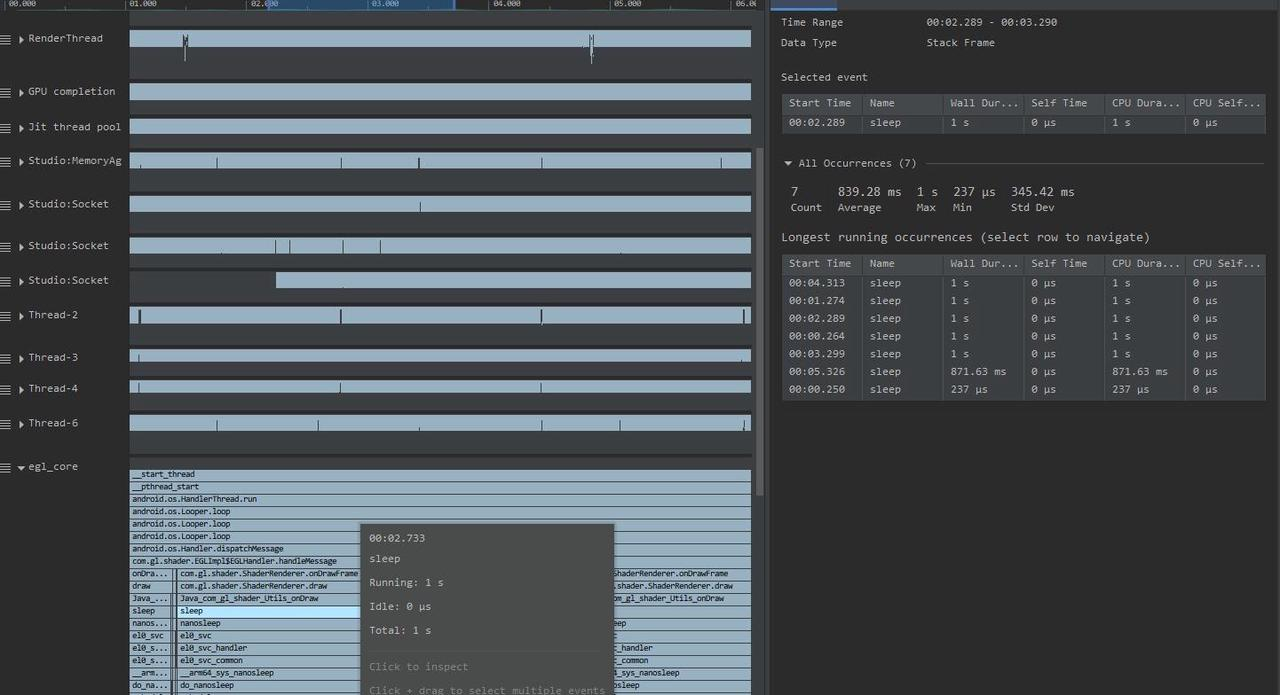
It becomes clear that the code executed a sleep function within the native Java_com_gl_shader_Utils_onDraw, pinpointing the culprit for the poor performance!
The greatest advantage of CPU Profiler in AS is the integration of various sub-tools, enabling all operations in one place. It’s incredibly convenient for application developers. However, system developers might not be so lucky.
2.4 Comparative Analysis
| Tool Name | Application Scenario | Data Type | Data Acquisition Method | Analysis Method |
|---|---|---|---|---|
| Systrace | Android System & App Performance Analysis | Trace Type | Unconditional Capture, Continuous Logging | Visual Analysis |
| Perfetto | Android System & App Performance Analysis | Metric Type, Trace Type | Unconditional Capture, Continuous Logging | Visual Analysis, Database Analysis |
| AS Profiler | Android System & App Performance Analysis | Trace Type | Unconditional Capture, Continuous Logging | Visual Analysis |
| SimplePerf | Java/C++ Function Execution Time Analysis, PMU Counters | Trace Type | Unconditional Capture, Continuous Logging | Visual Analysis, Text Analysis |
| Snapdragon Profiler Tools & Resources | Primarily for Qualcomm GPU Performance Analyzer | Trace Type, Metric Type | Unconditional Capture, Continuous Logging | Visual Analysis |
| Mali Graphics Debugger | ARM GPU Analyzer (for MTK, Kirin chips) | Trace Type, Metric Type | Unconditional Capture, Continuous Logging | Visual Analysis |
| Android Log/dumpsys | Comprehensive Analysis | Log Type | Conditional Capture, Continuous Capture but not Logging | Text Analysis |
| AGI (Android GPU Inspector) | Android GPU Analyzer | Trace Type, Metric Type | Unconditional Capture, Continuous Logging | Visual Analysis |
| eBPF | Dynamic Tracing of Linux Kernel Behavior | Metric Type | Dynamic Tracing, Conditional Capture, Continuous Capture but not Logging | Text Analysis |
| FTrace | Linux Kernel Tracing | Log Type | Static Code, Conditional Capture, Continuous Capture but not Logging | Text Analysis |
3 On “Instruments, Techniques, Philosophy”
Technical revolutions and improvements are often reflected at the “instruments” level. The development direction of tools by the Linux community and Google is towards enhancing the integration of tools so that necessary information can be easily found in one place, or towards the collection of more information. In summary, the development trajectory at the instruments level is traceable and developmental rules can be summarized. We need to accurately understand their capabilities and application scenarios during rapid iterations of tools, aiming to improve problem-solving efficiency rather than spending time learning new tools.
The “techniques” level depends on specific business knowledge, understanding how a frame is rendered, how the CPU selects processes for scheduling, how IO is dispatched, etc. Only with an understanding of business knowledge can one choose the right tools and correctly interpret the information provided by these tools. With rich experience, sometimes you can spot clues even without looking at the detailed information provided by tools. This is a capability that arises when your business knowledge is enriched to a certain extent, and your brain forms complex associative information, elevating you above the tools.
At the “philosophy” level, considerations are about the nature of the problem that needs to be solved. What is the essence of the problem? What extent should be achieved, and what cost should be incurred to achieve what effect? For solving a problem, which path has the highest “input-output ratio”? What is the overall strategy? To accomplish something, what should be done first and what should be done next, and what is the logical dependency relationship?
In subsequent articles, explanations will be provided in the “instruments, techniques, philosophy” manner for a technology or a feature. We aim not only to let you learn a knowledge point but also to stimulate your ability to extrapolate. When faced with similar tools or problems, or even completely different systems, you can handle them with ease. Firmly grasping the essence, you can choose the appropriate tools or information through evaluating the “input-output ratio” and solve problems efficiently.
About Me && Blog
- About Me: I am eager to interact and progress together with everyone.
- Follow me on Twitter
- Blog Content Navigation
- Record of Excellent Blog Articles - Essential Skills and Tools for Android Performance Optimization
An individual can move faster, a group can go further.