

This is the second article in the Android App ANR series, focusing on ANR analysis methodology and key logs. The series includes:
- Android App ANR Series 1: Understanding Android ANR Design Philosophy
- Android App ANR Series 2: ANR Analysis Methodology and Key Logs
- Android App ANR Series 3: ANR Case Studies
ANR (Application Not Responding) - a simple definition that encompasses much of Android’s system design philosophy.
First, ANR falls within the application domain. This differs from SNR (System Not Responding), which reflects issues where the system process (
system_server) loses responsiveness, while ANR explicitly confines the problem to applications. SNR is ensured by the Watchdog mechanism (details can be found in Watchdog mechanism and problem analysis); ANR is ensured by the message handling mechanism. Android implements a sophisticated mechanism at the system layer to detect ANR, with the core principle being message scheduling and timeout handling.Second, the ANR mechanism is primarily implemented at the system layer. All ANR-related messages are scheduled by the system process (
system_server) and then dispatched to application processes for actual processing. Simultaneously, the system process designs different timeout limits to track message processing. Once an application mishandles a message, the timeout limit takes effect: it collects system states such as CPU/IO usage, process function call stacks, and reports to the user that a process is not responding (ANR dialog; some ROMs don’t display the ANR dialog but directly crash to the home screen).Third, ANR issues are essentially performance problems. The ANR mechanism actually imposes restrictions on the application’s main thread, requiring it to complete the most common operations (starting services, processing broadcasts, handling input) within specified time limits. If processing times out, the main thread is considered to have lost the ability to respond to other operations. Time-consuming operations on the main thread, such as intensive CPU computations, heavy I/O, complex UI layouts, etc., all reduce the application’s responsiveness.
Finally, some ANR problems are very difficult to analyze. Sometimes due to underlying system influences, message scheduling fails, and the problematic scenario is hard to reproduce. Such ANR issues often require significant time to understand system behaviors, going beyond the scope of the ANR mechanism itself. Some ANR problems are hard to investigate because there are many factors causing system instability, such as memory fragmentation caused by Linux Kernel bugs, hardware damage, etc. Such low-level causes often leave ANR problems untraceable, and these aren’t application issues at all, wasting much time for application developers. If you’ve worked on entire system development and maintenance, you’ll deeply understand this. Therefore, I cannot guarantee that understanding all content in this chapter will solve every ANR problem. If you encounter very difficult ANR issues, I suggest talking to friends working on Framework, drivers, and kernel, or if the problem is just a one-in-a-hundred-thousand phenomenon that doesn’t affect normal program operation, I’d suggest ignoring it.
– From duanqz
ANR Analysis Methodology
ANR problems mainly stem from two causes: application-side issues and system-side anomalies. When analyzing ANR problems, the most important task is to determine which cause is responsible (though there are some gray areas, such as poorly written code that doesn’t manifest under normal conditions but quickly surfaces when the system has problems).
General ANR Analysis Steps:
- Check EventLog for specific ANR time (search for
am_anr) to see if it matches the ANR log, determining whether the ANR log is valid. If the ANR log is valid, analyze it to extract useful information: pid, tid, deadlocks, etc. When facing ANR problems, we need to question whether the trace before us is the original crime scene. If there is a lot of information output when ANR occurs, and CPU and I/O resources were tight at that time, the log output timestamp might be delayed by 10 to 20 seconds. So we sometimes need to be vigilant. However, normally, theam_anroutput time in EventLog is the earliest and closest to the actual ANR time. - Check MainLog (Android Log) or SystemLog for ANR details (search for “ANR in”), extracting effective information:
- Time when ANR occurred
- Process that printed the ANR log
- Process where ANR occurred
- Reason for ANR
- CPU load
- Memory load
- CPU usage statistics time period
- CPU usage rate of each process
- Total CPU usage rate
- Page fault counts
- xxx minor indicates page faults in cache, which can be understood as the process performing memory access
- xxx major indicates page faults in memory, which can be understood as the process performing I/O operations
- CPU usage summary
- Combine MainLog (Android Log) and EventLog to extract all useful information within the CPU start and end time points into a file:
- Collect key operations, such as unlock, app installation, screen on/off, app launch, etc.
- Collect exceptions and system key logs:
- System slowdown: such as Slow operation, Slow dispatch, Slow delivery,
dvm_lock_sample - Process changes:
am_kill,am_proc_died,lowmemorykiller, ANR, app launch relationships, etc. - System information: cpu info, meminfo, binder info (whether full), iowait (whether too high)
- System slowdown: such as Slow operation, Slow dispatch, Slow delivery,
- Collect all key thread running conditions and thread priorities of the ANR process
- Based on the key information file extracted in step 4, further understand the system’s situation and state at that time (recommend using vscode or notepad++ with global search for clues), such as:
- Was it in low memory frequently killing processes?
- First unlock after reboot with system busy?
- Multiple app launches in short time causing system busy?
- Or application’s own logic waiting?
- If still unclear, add logs to reproduce.
Distinguishing Between Application Problems and System Problems
First, Analyze Whether It’s an Application Problem
The key to analyzing application problems is to understand what the user was doing at that time and what role the application played during this user operation, then proceed with further analysis:
- Analyze whether there are time-consuming operations in key component lifecycles that might not be exposed normally but surface when system load increases (suggest adding corresponding logs in key lifecycle functions for easier debugging).
- Analyze whether extreme situations occurred causing application logic to be time-consuming, such as large amounts of data processing or import, too many threads running simultaneously, etc. (check application’s CPU / IO usage).
- Analyze whether deadlocks exist.
- Analyze whether waiting for binder return.
- Analyze whether MainThread and RenderThread have abnormalities in Trace files.
- Analyze whether MainThread and WorkerThread have waiting relationships in Trace files.
Analyze System State
- Check CPU usage (CPU usage rate and CPU load), see if system-related processes or threads like SystemServer,
lowmemorykiller,HeapTaskDeamon, Audio, SurfaceFlinger occupy high resources. - Check whether significant IO situations exist, check IO load:
- faults: 118172 minor (page faults in cache).
- major (page faults in memory).
- Check whether system is in low memory:
- Check
dumpsys meminforesults to see if in low memory. - Check kernel log for frequent
lowmemorykiller. - Check event log for frequent applications killed by system low memory policy.
- Check
kswapd0.
- Check
- Whether application is frozen: Application in D state, ANR occurs. If the last operation is
refriger, then the application was frozen. Normally caused by power optimization; check if there arexxxHansManager : unfreezelogs around; or in Systrace’s Kernel Callstack containing:{kernel callsite when blocked:: "\_\_refrigerator+0xe4/0x198"}. - Check for system anomalies: For instance, custom features causing system business, failing to respond to application Binder requests in time. This requires analyzing SystemServer logs in the Log to see if there are abnormal log outputs.
Continue Analysis: Can Application Resolve It or System Resolve It?
- If the ANR problem is transferred to the system side, there is a high probability it’s unsolvable by the app.
- If the application code is normal, and there are no extreme usage scenarios or data processing, purely caused by the system or other Apps, then it can be considered a system issue.
- If the application code itself has certain issues, which are not exposed in non-extreme scenarios or non-system anomalies, then the application needs to consider mitigation plans.
ANR Log Content
Logs can be captured via test tools, obtained from online platforms, or captured manually:
1 | adb bugreport log.zip |
ANR Trace Log contains the following content:
Thread Details
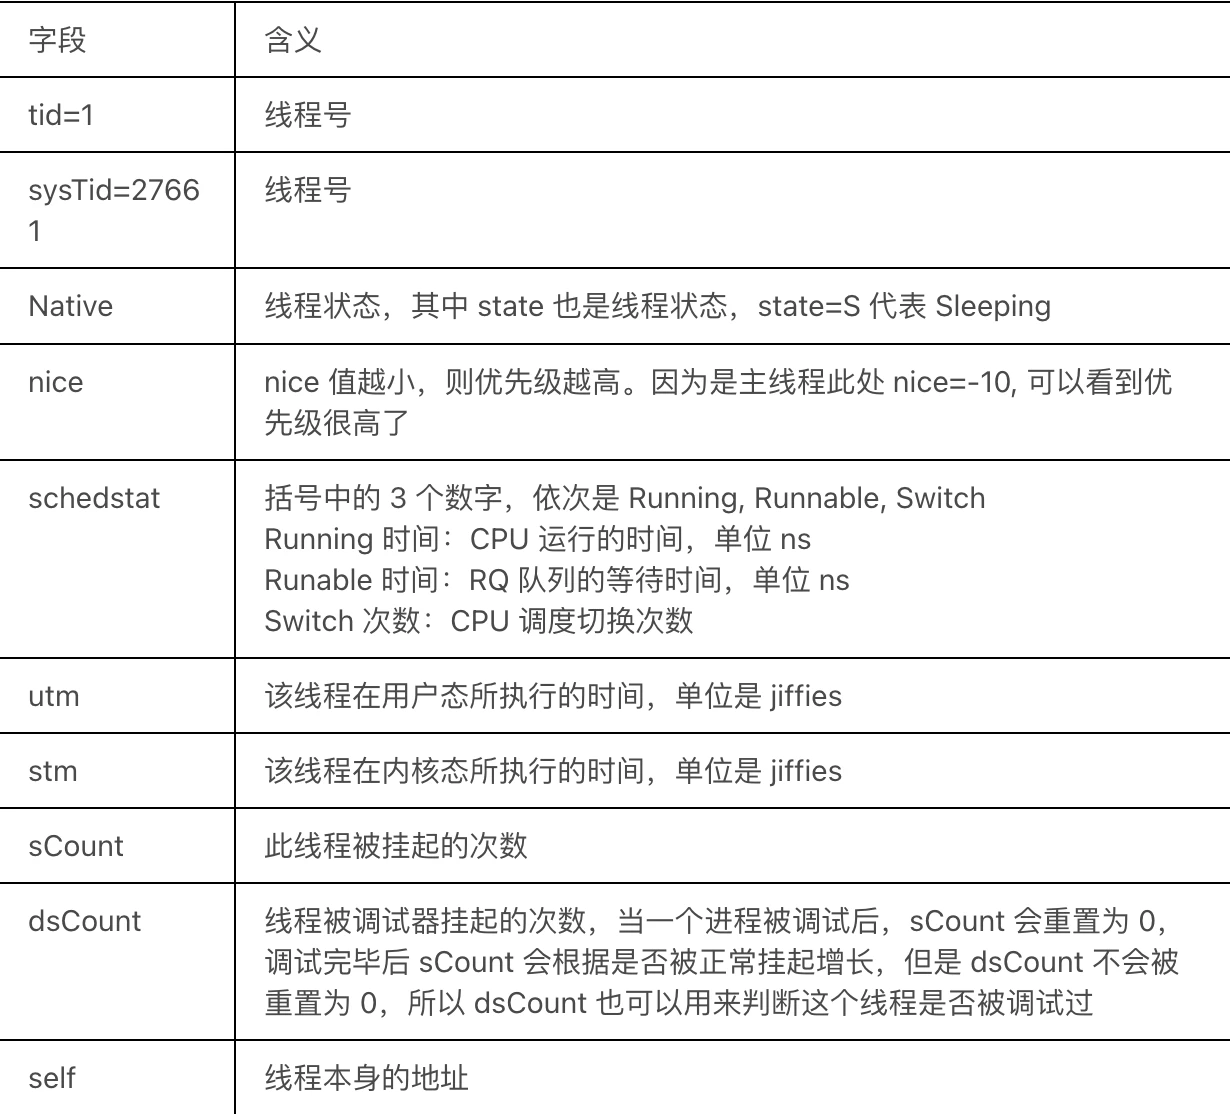
1 | "main" prio=5 tid=1 Native |
Ideally, the meaning of some fields in the Trace above:
Thread Stack
Below is the call stack corresponding to the thread:
1 | native: #00 pc 00000000000c6418 /apex/com.android.runtime/lib64/bionic/libc.so (__epoll_pwait+8) |
Divided into Java and Native. Generally speaking, nativePollOnce is waiting for a Message, which is normal.
Thread State
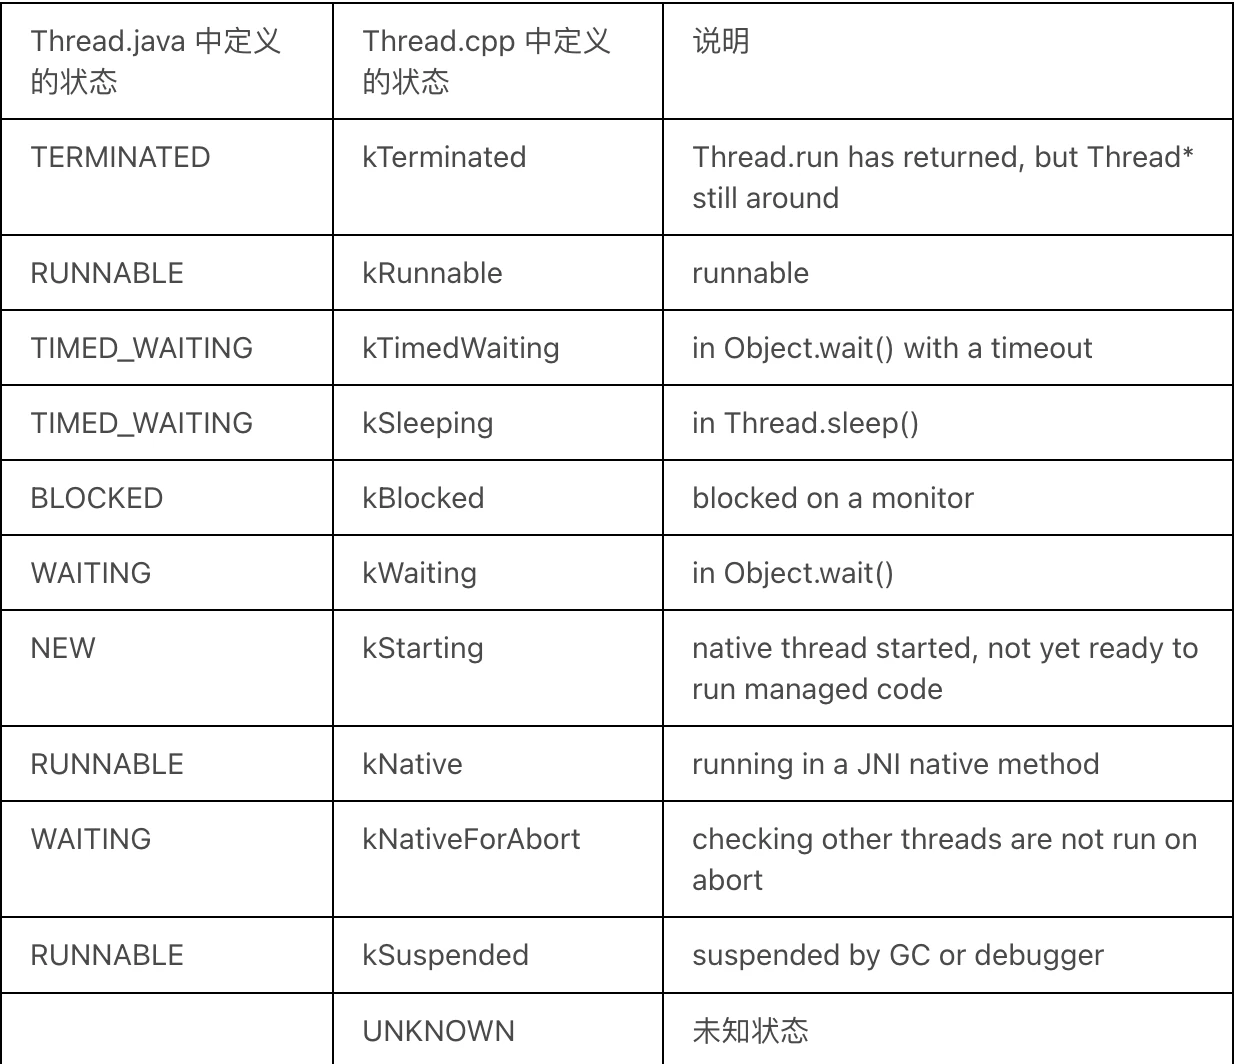
There is a correspondence between the state in Thread.java and the state in Thread.cpp. It can be seen that the former is more generalized and easier to understand, oriented towards Java users; while the latter is more detailed, oriented towards the internal environment of the virtual machine. The thread states displayed in traces.txt are defined in Thread.cpp. The complete correspondence is as follows:
art/runtime/thread_state.h
1 | // State stored in our C++ class Thread. |
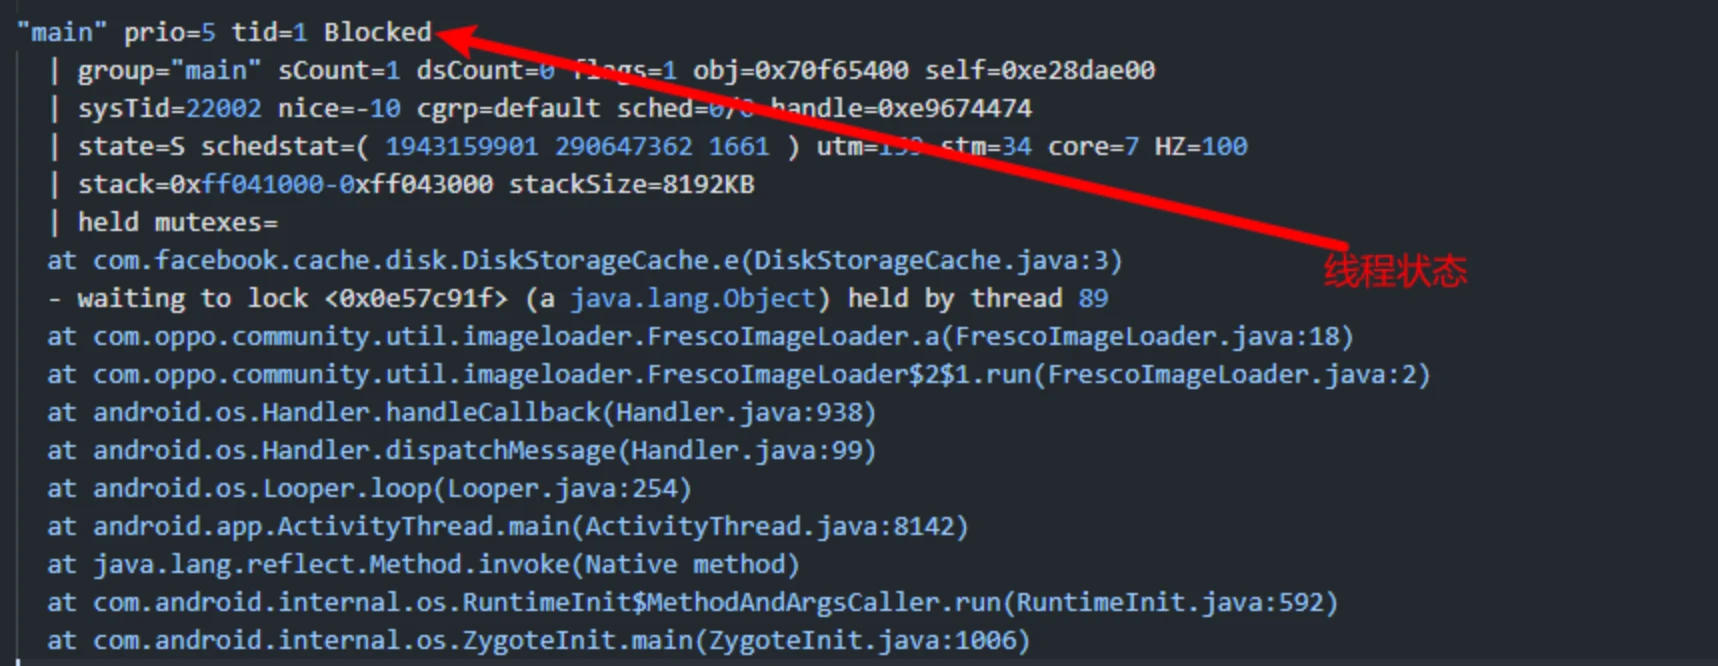
In the Trace file, the last line of the thread name identifies the current state of the thread.
Normal Main Thread Trace
1 | "main" prio=5 tid=1 Native |
Abnormal Main Thread Trace
1 | "main" prio=5 tid=1 Blocked |
CPU Usage Analysis
Searching for the keyword ANR in reveals the CPU usage within a period of time before the ANR. The parsing is as follows:
1 | ActivityManager: ANR in com.xxx.launcher (com.xxx.launcher/.Launcher)(Process Name) |
CPU Load
1 | ActivityManager: Load: 15.29 / 5.19 / 1.871 |
The three numbers after Load mean the average system load in 1 minute, 5 minutes, and 15 minutes respectively. When the CPU is completely idle, the average load is 0; when the CPU workload is saturated, the average load is 1. The Load helps to judge whether the system load is too heavy.
There is a vivid metaphor: Imagine the CPU as a bridge with only one lane. All vehicles must pass through this lane. A system load of 0 means there are no cars on the bridge. A system load of 0.5 means half of the bridge section has cars. A system load of 1.0 means all sections of the bridge have cars, that is, the bridge is already “full”. A system load of 2.0 means there are too many vehicles, the bridge is already full (100%), and there are clearly as many vehicles waiting to get on the bridge. The traffic capacity of the bridge is the maximum workload of the CPU; the vehicles on the bridge are the waiting processes.
The rule of thumb is:
- When the system load is consistently greater than 0.7, you must verify it, where is the problem, to prevent the situation from getting worse.
- When the system load is consistently greater than 1.0, you must find a solution to bring this value down.
- When the system load reaches 5.0, it indicates that your system has serious problems.
Modern mobile phones use multi-core CPU architectures. Eight cores are common, meaning the CPU processing capacity is multiplied by 8. The running time of each core can be obtained from the following file: /sys/devices/system/cpu/cpu%d/cpufreq/stats/time_in_state, where %d represents the CPU core. The file records the running time of the CPU at various frequencies from boot to reading the file, unit: 10 ms.
Memory Load
1 | ActivityManager: ----- Output from /proc/pressure/memory -----(Memory Pressure) |
Memory load is obtained from /proc/pressure/memory.
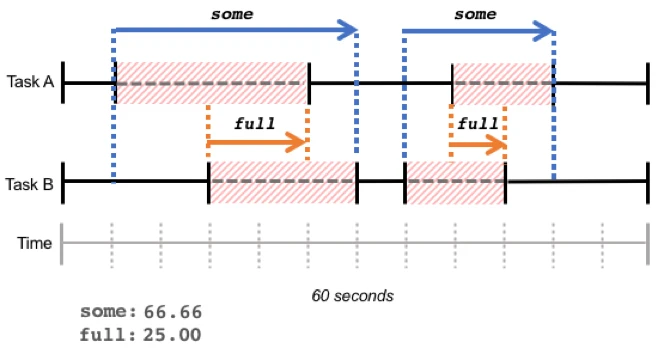
avg10, avg60, avg300 represent the percentage of blocking time within the time period of 10s, 60s, and 300s respectively. total is the total accumulated time in milliseconds.
The some line represents the percentage of time that at least one task is blocked on a certain resource. The full line represents the percentage of time that all non-idle tasks are blocked at the same time. During this period, the CPU is completely wasted, which will bring serious performance problems. Let’s take IO some and full as an example. Suppose that in a 60-second time period, the system has two tasks. The running status within the 60-second cycle is shown in the figure below:
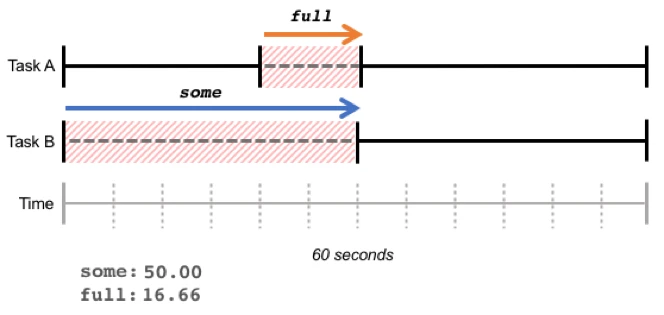
The red shaded part indicates that the task enters the blocked state due to waiting for IO resources. The part where Task A and Task B are blocked at the same time is full, accounting for 16.66%; the part where at least one task is blocked (including the part where only Task B is blocked) is some, accounting for 50%.
some and full are the sum of the proportion of blocking time within a certain period of time. The blocking time is not necessarily continuous, as shown in the figure below:
For details, please refer to the article by Kernel Craftsman: https://blog.csdn.net/feelabclihu/article/details/105534140
IO Load
1 | ActivityManager: 30% 5991/com.xxx.launcher: 23% user + 6.4% kernel / faults: 118172 minor(cache page faults) 2 major(memory page faults) |
- Minor: Page faults in high-speed cache, referring to Minor Page Fault (MnPF). When disk data is loaded into memory, the kernel will issue an MnPF message when reading it again. When a file is read and written for the first time, there will be many MPFs. After being cached into memory, accessing MPF again will be very few, and MnPF will increase instead. This is the result of the caching technology adopted by the kernel to reduce inefficient disk I/O operations. It can be understood as the process performing memory access.
- Major: Page faults in memory, referring to Major Page Fault (MPF). When the kernel reads data, it will search the CPU’s high-speed cache and physical memory successively. If not found, it will issue an MPF message requesting to load data into memory. It can be understood as the process performing IO operations.
If there are a large number of major, it means that the IO operation load was relatively high at that time.
Process Load
1 | ActivityManager: 30% 5991/com.xxx.launcher: 23% user + 6.4% kernel / faults: 118172 minor(Minor page faults) 2 major(Major Page faults) |
- 23% user: cpu usage in user mode
- 6.4% kernel: cpu usage in kernel mode
CPU Anomalous Process
- SystemServer cpu usage is high: the overall system operation will be slow.
- kswapd0 cpu usage is high: the overall system operation will be slow, causing various ANRs. Transfer the problem to “Memory Optimization” and ask them to optimize.
- logd CPU usage is high: causes system lag and ANR because the operation of each process outputting LOG is blocked and executes extremely slowly.
- Vold CPU usage is too high: causes system lag and ANR, please verify with the colleague responsible for storage first.
- Application itself CPU usage is high: high probability of the application’s own problem.
- Application is in D state, ANR occurs: If the last operation is
refriger, then the application is frozen. Normally, it is caused by power consumption optimization. You can check whether there is a Log likexxxHansManager : unfreezebefore and after; or in Systrace, the Kernel Callstack shows:{kernel callsite when blocked:: "__refrigerator+0xe4/0x198"}. - “+” before CPU usage rate: Some processes have a “+” sign before their CPU usage rate, such as
catandzygote64, indicating that these processes did not exist in the last CPU statistics time slice, but ran in this CPU statistics time slice. Similarly, there is a “-“ sign, indicating that these processes died during the two CPU statistics time slices.
Key System Log Introduction
Application Freezing
1 | xxxHansManager : freeze uid: 10245 package: com.tencent.mm reason: LcdOff |
If the freezing logic has a Bug, it will also cause the application to generate an ANR. This line of Log is relatively simple, mainly the frozen process information and the reason for freezing.
ActivityManager : Slow operation
When AMS performs key tasks, if the task takes longer than 50 ms, it will print the corresponding Log.
frameworks/base/services/core/java/com/android/server/am/ActivityManagerService.java
1 | void checkTime(long startTime, String where) { |
The corresponding Log is as follows. If such Logs are printed frequently in the system, it means that the system is currently in a relatively stuck state, and system factors must be considered during analysis.
1 | ActivityManager: Slow operation: 138ms so far, now at startProcess: done updating battery stats |
Looper : Slow dispatch
1 | Looper : Slow dispatch took 418ms main h=android.app.ActivityThread$H c=android.app.-$$Lambda$LoadedApk$ReceiverDispatcher$Args$_BumDX2UKsnxLVrE6UJsJZkotuA m=0 |
Looper : Slow delivery
1 | Looper : Slow delivery took 361ms android.ui h=com.android.server.am.ActivityManagerService$UiHandler c=null m=53 |
Looper:Slow Looper
1 | W/Looper: Slow Looper main: Activity com.androidperformance.memoryfix/.MainActivity is 439ms late (wall=0ms running=0ms ClientTransaction{ callbacks=[android.app.servertransaction.TopResumedActivityChangeItem] }) because of 3 msg, msg 2 took 268ms (seq=2 running=207ms runnable=15ms late=1ms h=android.app.ActivityThread$H w=110), msg 3 took 171ms (seq=3 running=140ms runnable=5ms io=1ms late=268ms h=android.app.ActivityThread$H w=159) |
onTrimMemory
1 | ClockTag AlarmClockApplication: onTrimMemory: 80 |
dvm_lock_sample
When the blocked time of a thread waiting for a lock exceeds the threshold (for example: 500ms), the current lock holding status is output.
1 | dvm_lock_sample:[system_server,1,Binder_9,1500,ActivityManagerService.java,6403,-,1448,0] |
- system_server: Binder_9 executes to line 6403 of ActivityManagerService.java, and has been waiting for the AMS lock.
- “-“ means that the lock is held by the same file, that is, the lock is held by line 1448 of the same file code, causing the Binder_9 thread to be blocked for 1500ms.
binder_sample
binder_sample: Monitors the binder transaction duration of the main thread of each process. When it exceeds the threshold (for example: 500ms), the corresponding target call information is output.
1 | 6628 6628 I binder_sample: [android.view.accessibility.IAccessibilityManager,6,2010,com.xxx.community,100] |
- The process is 6628, main thread 6628
- Executing
android.view.accessibility.IAccessibilityManagerinterface - The corresponding method code = 6 (i.e.,
TRANSACTION_addAccessibilityInteractionConnection) - The time spent is 2010 ms
- The package where the block is located is
com.xxx.community - The last parameter is the sample ratio
Find the corresponding interface function, such as which function corresponds to Code = 6 in IAccessibilityManager in the above example. You can search for FIRST_CALL_TRANSACTION in cs.android.com, click call, and then view the corresponding IAccessibilityManager file in the out directory (scroll all the way down until you can search for IAccessibilityManager).
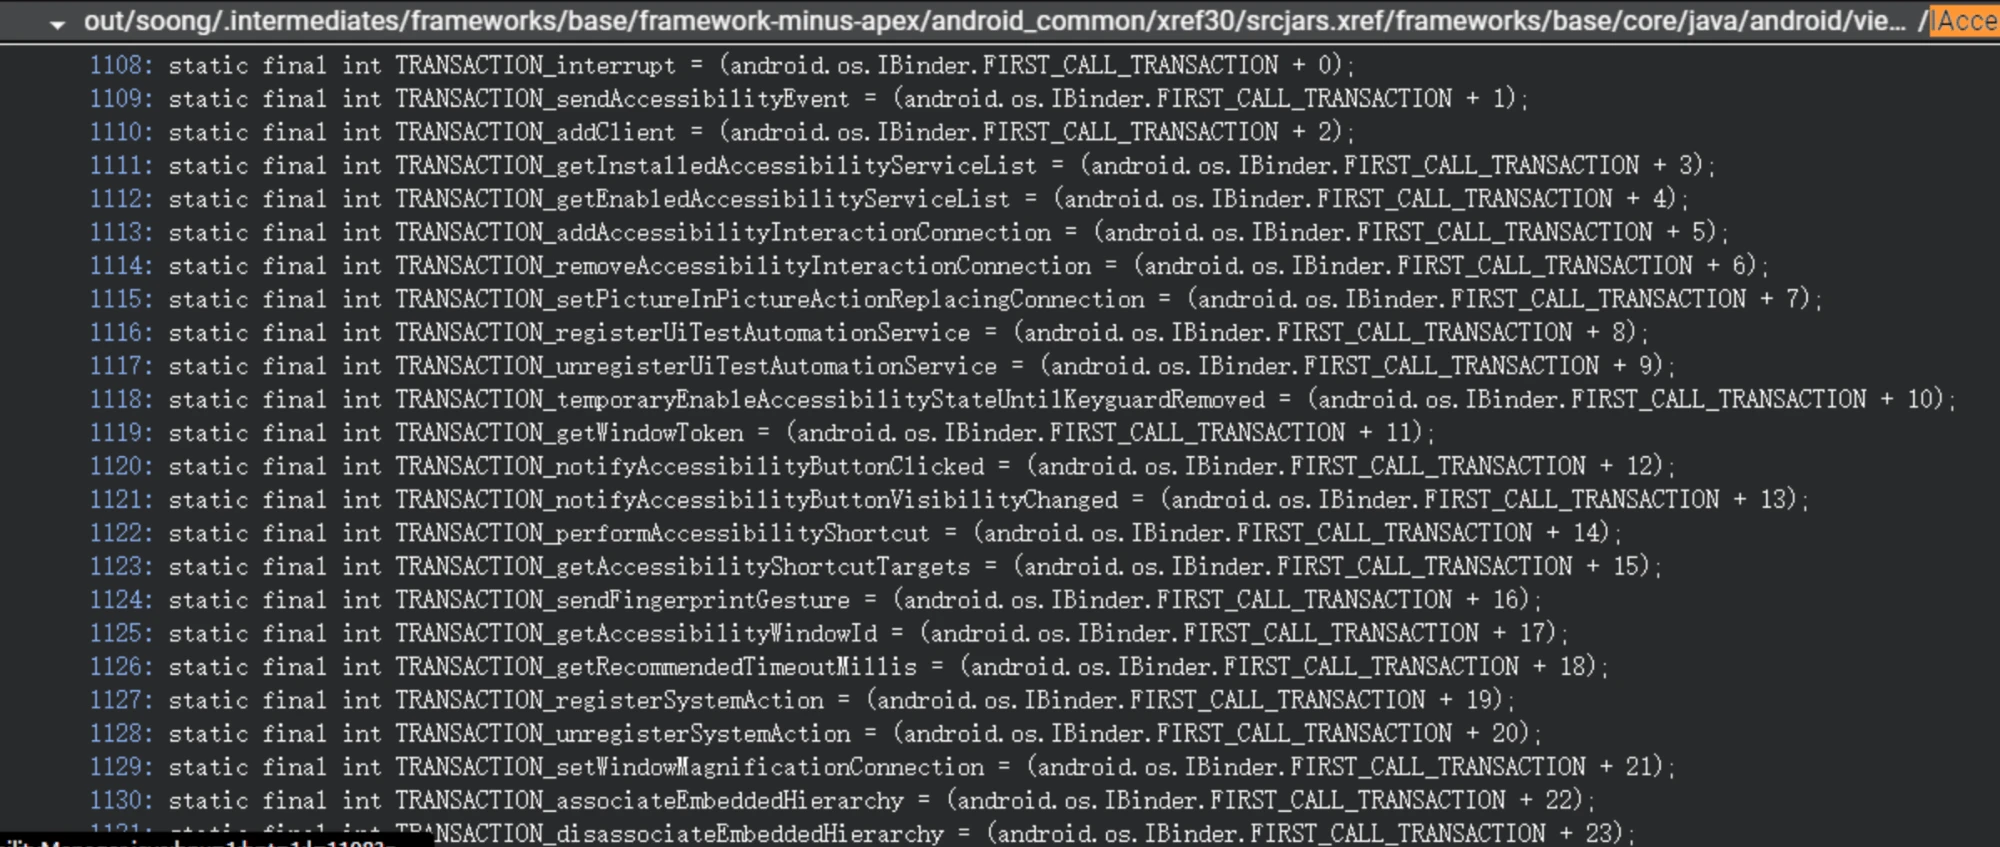
Among them, the corresponding static final int TRANSACTION_addAccessibilityInteractionConnection = (android.os.IBinder.FIRST_CALL_TRANSACTION + 5)
Long monitor contention
1 | 16809 14216 W system_server: Long monitor contention with owner InputDispatcher (17039) at android.content.res.Configuration com.android.server.wm.ActivityTaskManagerService.getGlobalConfigurationForPid(int)(ActivityTaskManagerService.java:1066) waiters=0 in boolean com.android.server.wm.WindowProcessController.hasActivities() for 141ms |
art/runtime/monitor.cc
1 | std::string Monitor::PrettyContentionInfo(const std::string& owner_name, |
Binder Thread
When the thread pool of processes such as system_server is used up and there are no idle threads, binder communication is in a starvation state. If the starvation state exceeds a certain threshold, information is output.
1 | E IPCThreadState: binder thread pool (31 threads) starved for 120 ms |
am_kill
1 | am_kill : [0,18555,com.sina.weibo.image,945,remove task]1 |
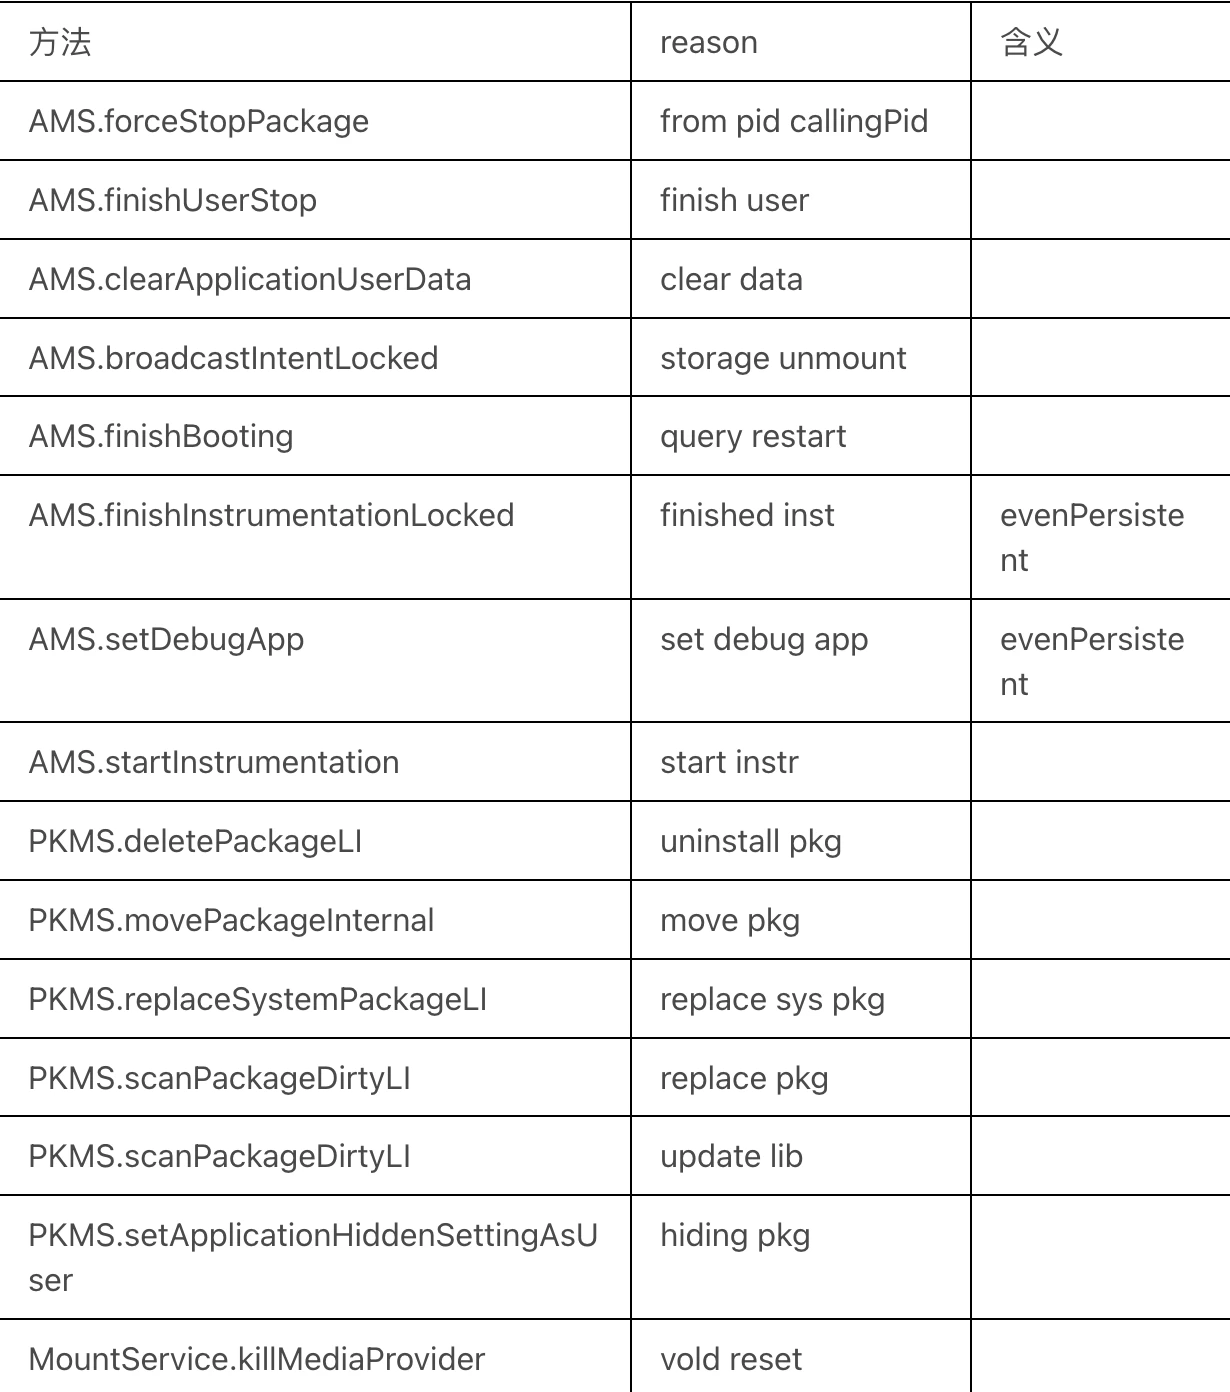
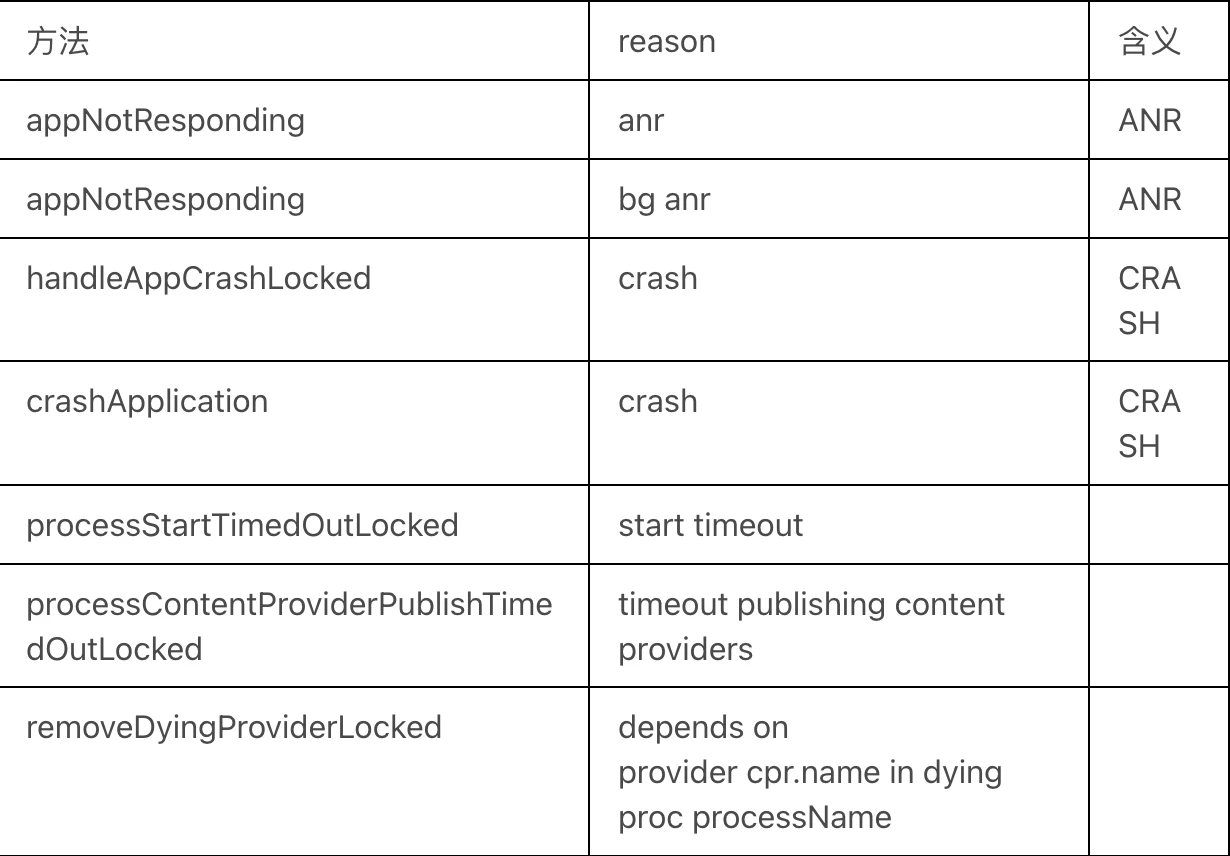
In the sentence above, remove task refers to the reason why this application was killed.
The following are the Reasons corresponding to various killed situations. Sometimes we need to see the reason why the application was killed to judge whether the system is normal or the user’s operation steps:
force-stop
Abnormal Process Kill
Active Process Kill
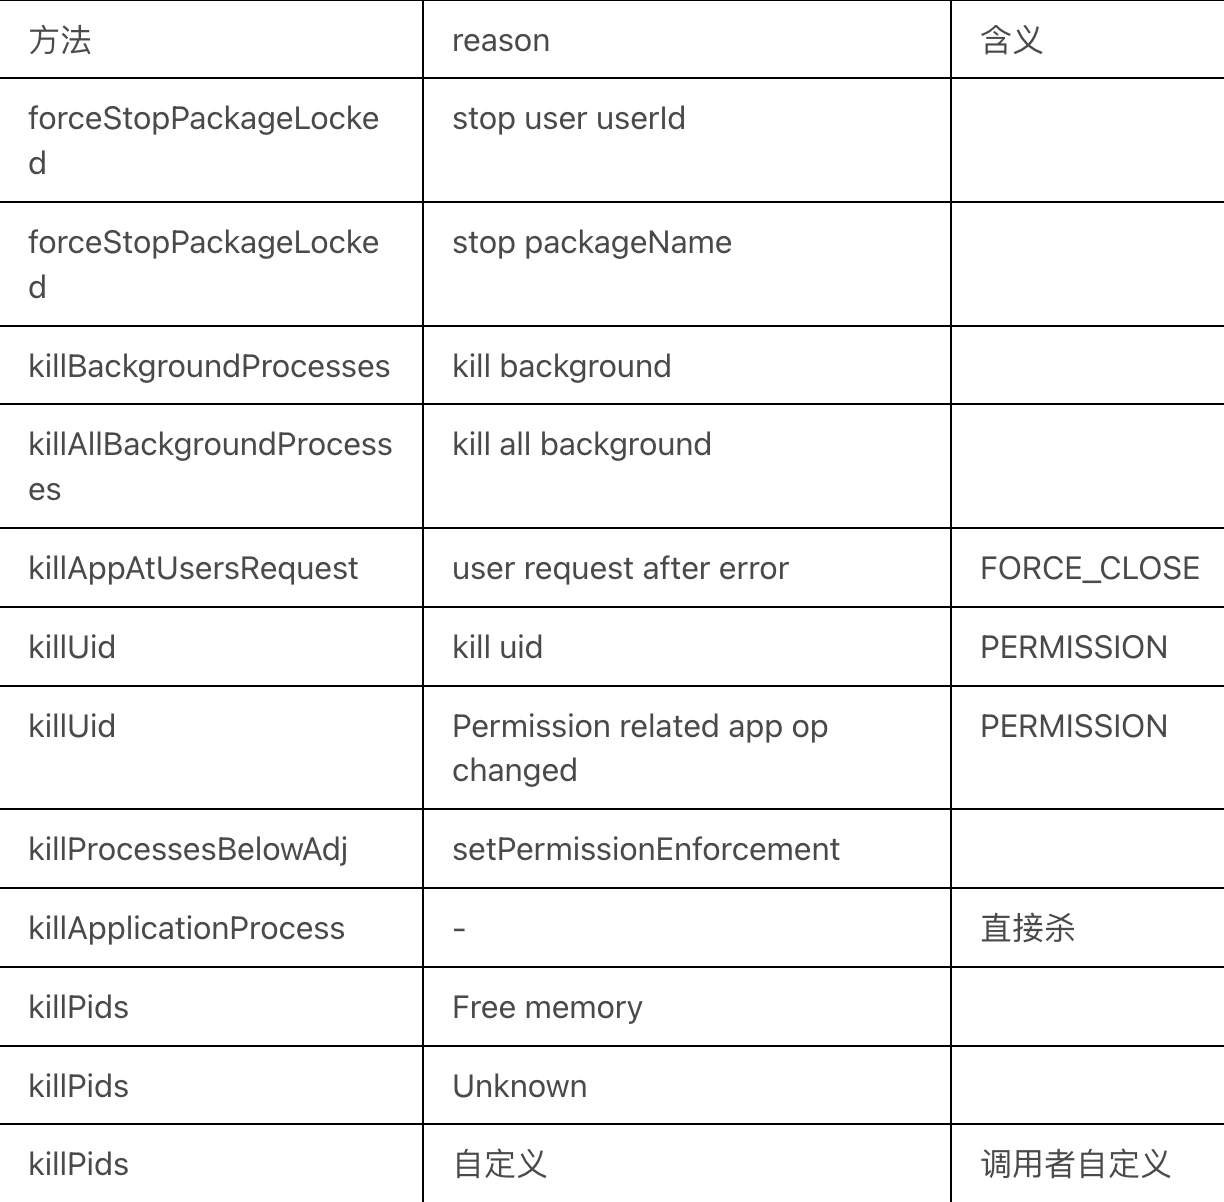
Schedueled Process Kill
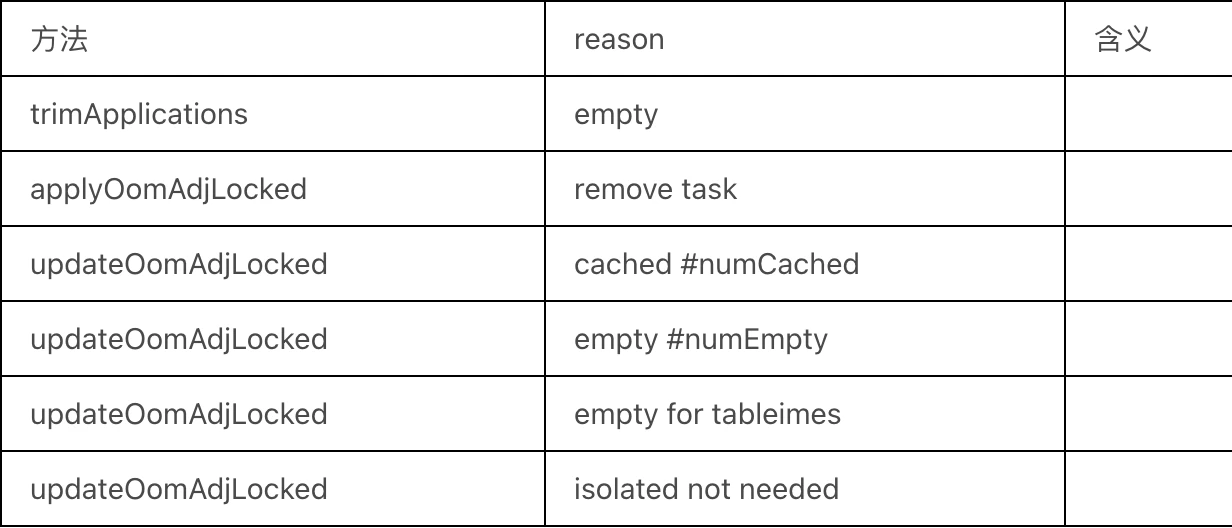
Other Process Kill
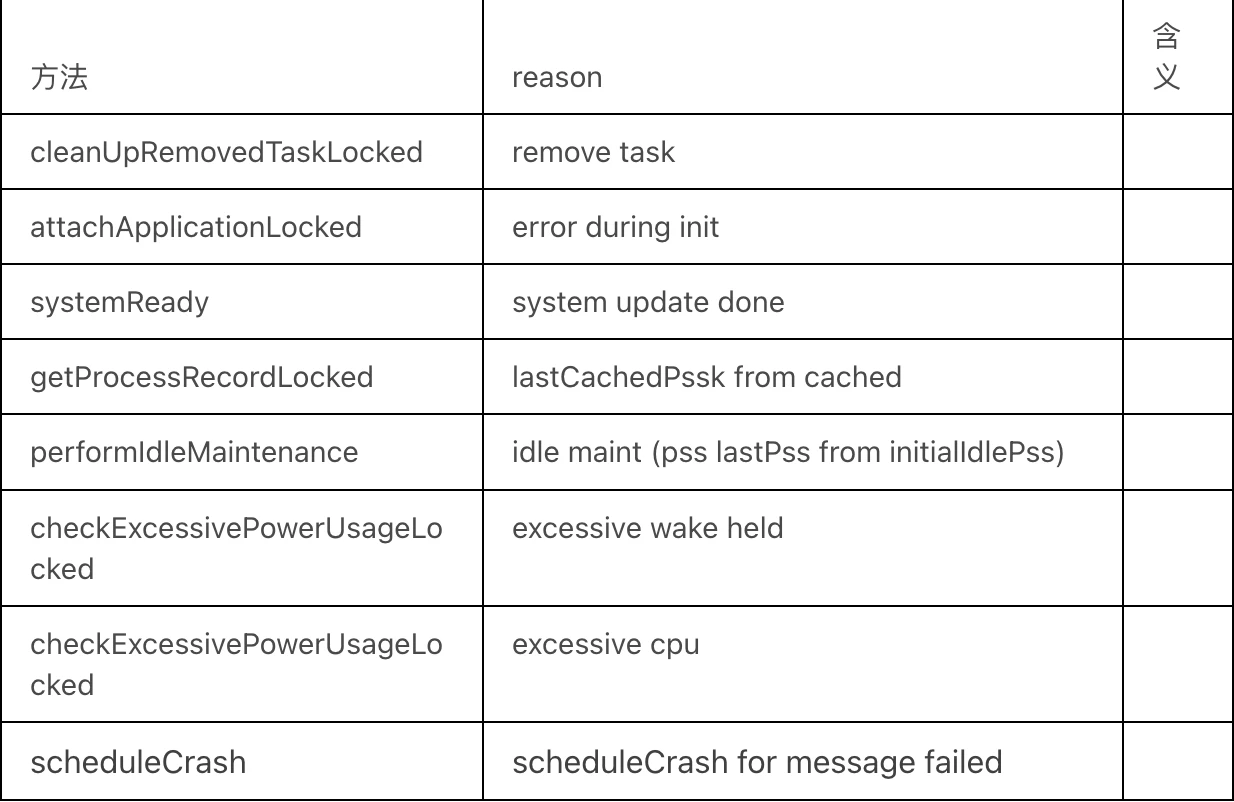
All the process kills introduced above call the ProcessRecord.kill() method, which inevitably outputs the corresponding EventLog. So what other scenarios of killing processes will not output log?
Process.killProcess(int pid)// Can kill any specified process, or send signal directlyadb shell kill -9 pid// Can kill any specified process- Killed by
lmkdirectly
That is to say, if a process is killed without log output, it may be killed by directly calling kill or sending a signal, or perhaps killed by lmk.
am_proc_died
1 | am_proc_died: [0,13210,com.xxx.gallery3d,935,19] |
am_anr
1 | am_anr : [0,8769,com.android.updater,952680005,Broadcast of Intent { act=android.intent.action.BOOT_COMPLETED flg=0x9000010 cmp=com.android.updater/.BootCompletedReceiver (has extras) }] |
- Process pid: 8769
- Process name:
com.android.updater - The type of ANR occurred is: Specific class or reason for BroadcastTimeout:
{ act=android.intent.action.BOOT_COMPLETED flg=0x9000010 cmp=com.android.updater/.BootCompletedReceiver (has extras) }
Lowmemorykiller
The log of lowmemorykiller is in the kernel log.
1 | lowmemorykiller: Kill 'com.heytap.themestore' (15545), uid 10136, oom_adj 995 to free 105068kB |
Killing applications through the lowmemorykiller mechanism:
com.heytap.themestoreprocess name- 15545: PID
- 10136: UID
- 995:
oom_adj - 105068kB: released memory
- 606:
min_adj
Blocked msg
Internally added Log, when the execution time of Message exceeds 1.5s, the following Log will be printed. From the following Log, we can see:
- The Message that timed out, and the execution time of this Message
- The Message blocked by this Message
From this Log, you can observe whether your Message execution blocked other Messages or your Message was blocked by other Messages.
1 | E ANR_LOG : >>> msg's executing time is too long |
Common Scenario Logs Introduction
Screen Off Log
The key is power_screen_broadcast_done, screen_toggled and power_screen_state.
1 | 1810 2470 I intercept_power: [ACTION_DOWN,1,0] |
Screen On Log
The key is power_screen_broadcast_done, screen_toggled and power_screen_state.
Where power_screen_state:
- offOrOn|1|5
- becauseOfUser|1|5
- totalTouchDownTime|2|3
- touchCycles|1|1
- latency|1|3
1 | 1810 2470 I intercept_power: [ACTION_DOWN,1,0] |
Unlock Complete Log
Values of wm_set_keyguard_shown:
- (keyguardShowing|1): Whether Keyguard is showing
- (aodShowing|1): Whether aodShowing is showing
- (keyguardGoingAway|1): Keyguard disappearing
- (Reason|3): Reason
1 | 1810 5711 I wm_set_keyguard_shown: [1,0,1,keyguardGoingAway] |
Notification Panel Pull Down Log
1 | 2768 2768 I sysui_multi_action: [757,803,799,panel_open,802,1] |
Notification Panel Collapse Log
1 | 2768 2768 I sysui_multi_action: [757,111,758,2] |
App Launch Log
1 | // Create Task |
Window Focus Related Flows
1 | // App launch from Launcher, focus change: Launcher => null => App |
ANR Related Information Sharing
- Xigua Video Stability Governance System Construction 1: Tailor Principle and Practice
- Xigua Video Stability Governance System Construction 2: Raphael Principle and Practice
- Xigua Video Stability Governance System Construction 3: Sliver Principle and Practice
- Xigua Freeze & ANR Optimization Governance and Monitoring System Construction
- Toutiao ANR Optimization Practice Series - Design Principle and Influencing Factors
- Toutiao ANR Optimization Practice Series - Monitoring Tools and Analysis Ideas
- Toutiao ANR Optimization Practice Series - Example Analysis Collection
- Toutiao ANR Optimization Practice Series - Barrier Causes Main Thread Deadlock
- Toutiao ANR Optimization Practice Series - Goodbye, SharedPreference Waiting
- Android ANR | Principle Analysis and Common Cases
Reference
- https://duanqz.github.io/2015-10-12-ANR-Analysis#1-%E6%A6%82%E8%A7%88
- https://duanqz.github.io/2015-10-12-ANR-Analysis
- http://gityuan.com/2016/12/02/app-not-response/
- http://gityuan.com/2017/01/01/input-anr/
- https://xiaozhuanlan.com/topic/5097486132
About Me && Blog
Below is a personal introduction and related links. I look forward to communicating with you all!
- Blogger Personal Introduction: Contains personal WeChat and WeChat group links.
- Blog Content Navigation: A navigation of personal blog content.
- Excellent Blog Articles Collected and Organized by Individuals - Must-Know for Android Performance Optimization: Welcome everyone to recommend yourself and recommend (WeChat private chat is fine)
- Android Performance Optimization Knowledge Planet: Welcome to join, thanks for support~
One person can go faster, a group of people can go further