This is the first article in the “Systrace Thread CPU State Analysis Tips” series. It analyzes the causes of the “Runnable” state in Systrace and provides optimization strategies for when Runnable segments are excessively long.
The goal of this series is to use Systrace to view the Android system from a different perspective and to learn the Framework through visualization. While reading Framework source code can be difficult to remember, seeing the flow in Systrace can lead to deeper understanding. You can find the complete Systrace Basics and Action Series here.
Table of Contents
- Runnable State Explanation
- Causes for Long Runnable States and Optimization Strategies
- About Me && Blog
- Systrace Thread CPU State Analysis Tips - Runnable
- Systrace Thread CPU State Analysis Tips - Running
- Systrace Thread CPU State Analysis Tips - Sleep and Uninterruptible Sleep
Runnable State Explanation
Visualizing Runnable in Trace
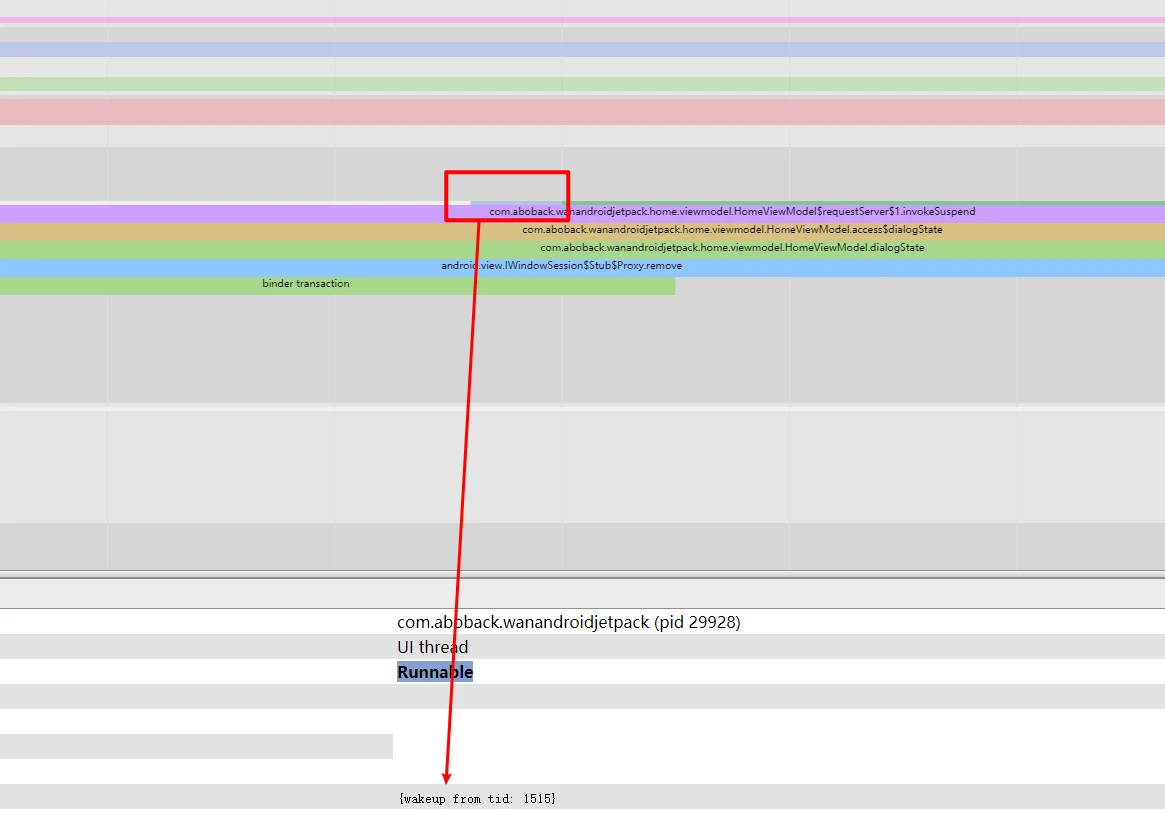
The article Systrace Thread CPU State Analysis Tips - Running discusses why the “Running” state might take a long time. This section focuses on the principles of the “Runnable” state and corresponding troubleshooting. In Systrace, it appears as a blue segment, indicating that the thread is in a Runnable state, waiting to be scheduled by the CPU.
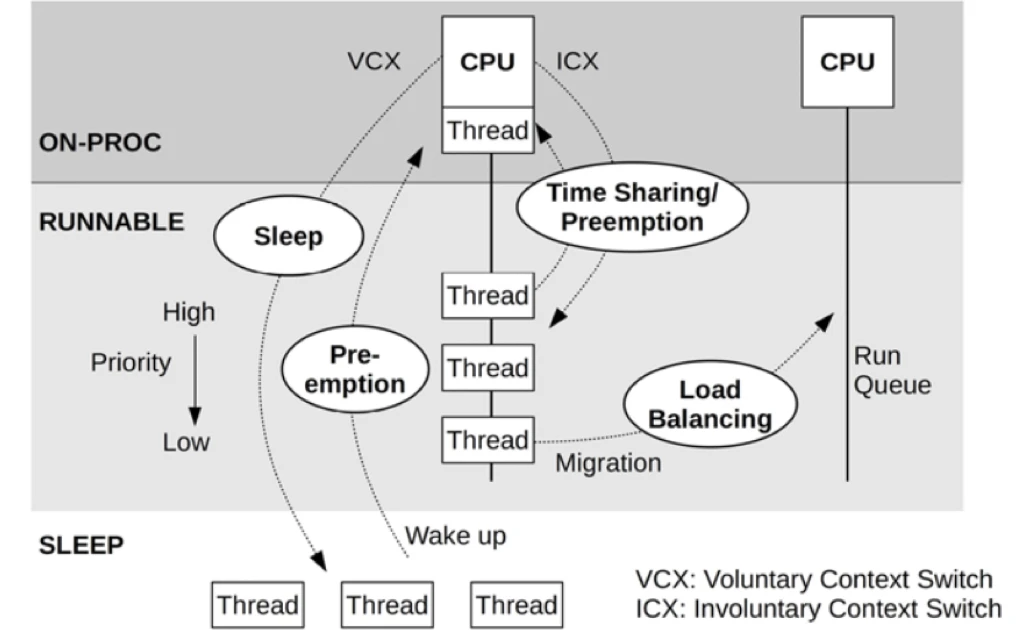
As shown in Figure 2, a CPU core can only execute one thread at any given moment. Therefore, all tasks waiting for execution are queued in a “runnable queue” (or “run queue”), with one queue per CPU core. A thread in this queue has already acquired all necessary resources (IO, locks, semaphores, etc.) except for the CPU itself. In this state, the thread is marked as RUNNABLE, which appears as the blue segments in Systrace.
The Linux kernel achieves multitasking by giving threads time slices and rotating them. When a “Running” thread’s time slice (typically in milliseconds) expires, it is set to “Runnable” to wait for its next turn. A special case is “preemption,” where a high-priority thread interrupts a running thread before its time slice expires.
Multi-core CPUs can execute multiple threads simultaneously, so it’s not always necessary for everyone to wait on the same core. The Linux scheduler manages “load balancing” by migrating threads across cores based on load. It uses “Schedule Classes” to manage priorities:
- SCHED_RR, SCHED_FIFO: Real-time classes with higher priority than NORMAL.
- SCHED_NORMAL: Common class, currently using the CFS (Completely Fair Scheduler).
Real-time priorities outrank normal priorities; high-priority tasks can preempt low-priority ones, and low-priority tasks must wait for high-priority ones to finish. Usually, Runnable durations are very short, but anomalies can prevent critical tasks from finishing within deadlines.
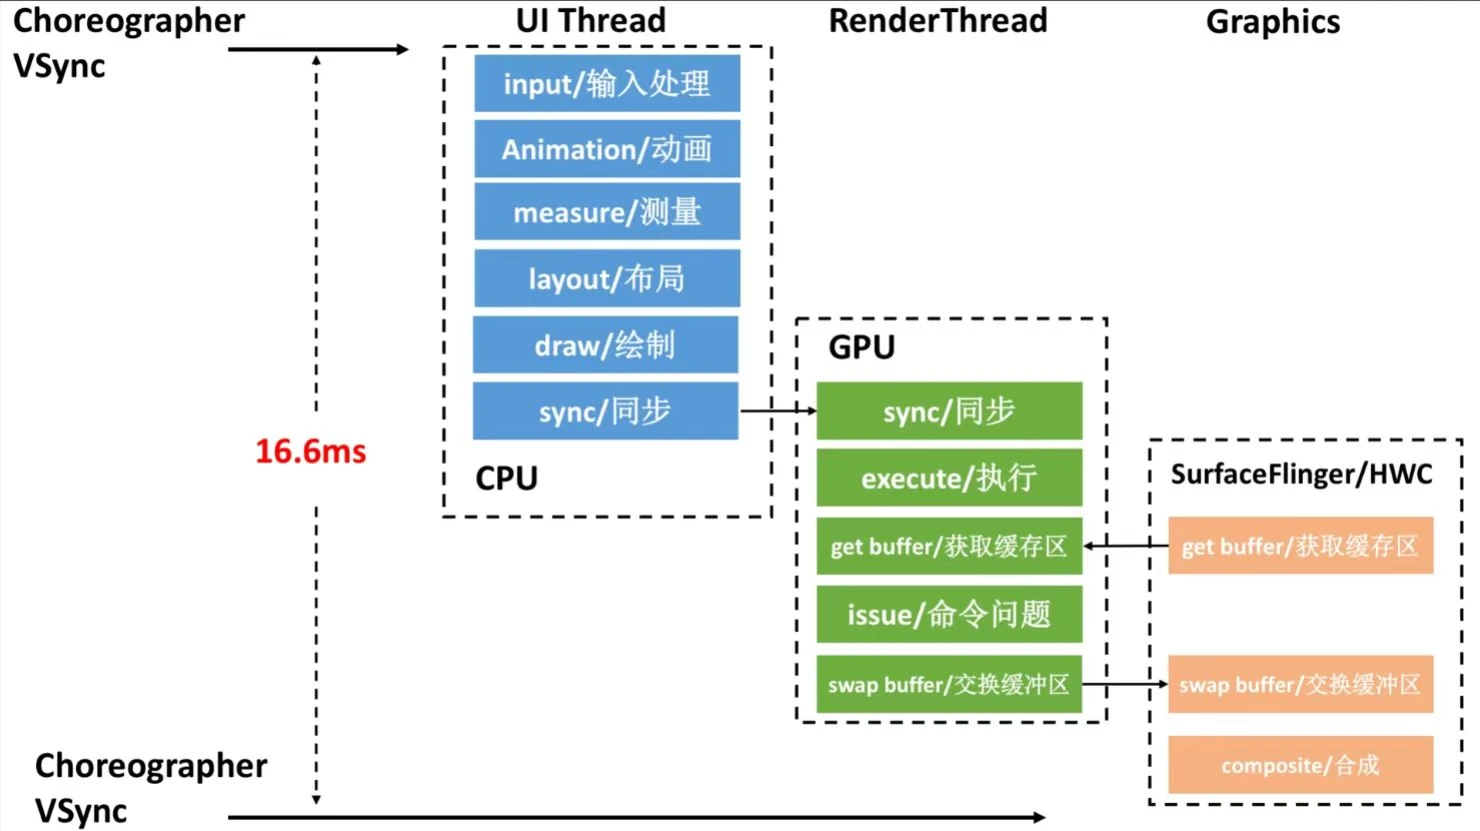
This often involves multiple threads, especially for UI tasks. In AOSP, a typical frame flows through UI Thread → Render Thread → SurfaceFlinger → HWC (Figure 3). If any thread in this chain is blocked in a Runnable state and misses the rendering deadline, jank (frame drop) occurs.
Causes of Long Runnable States and Optimization Strategies
We categorize common causes into 5 major groups. Most are system-level, but App logic can also cause long Runnable states.
Cause 1: Incorrect Priority Settings
- App priority too high: Preempts other tasks, making them appear lower priority and causing them to wait.
- App priority too low: If the thread is on a “critical path,” it has a higher chance of being stuck as Runnable, leading to jank.
- System Bugs: Framework incorrectly assigning very high or low priorities.
Optimization Strategies:
- Adjust thread priority based on the scenario; identify which thread is preempting yours in the Trace.
- System-level: Set critical threads to the
FIFOscheduling policy.
In practice, many Apps become more laggy after setting custom priorities because their strategy might work on one device but clash with the custom scheduler of another manufacturer. Generally, third-party developers should avoid direct priority APIs to prevent counterproductive results.
A more reliable long-term approach is designing a proper task model—never put time-sensitive tasks on generic worker threads.
Cause 2: Improper CPU Affinity (Core Binding)
To speed up execution, developers often bind threads to “Big Cores.” While this helps the “Running” phase, it must be done cautiously. Binding a thread to a specific core prevents it from running anywhere else, even if other cores are idle. If too many threads are bound to the same core, that core becomes a bottleneck, leading to long “Runnable” queues.
Core Binding Tips:
- Don’t bind to a single core: This has zero fault tolerance. If that core is preempted, the thread must wait. Bind to a “CPU Cluster” (e.g., Big Cores 4-7) instead.
- Avoid cluster overcrowding: On platforms with only 2 big cores, binding too many threads to them quickly leads to saturation, making binding a “negative optimization.”
- Identify cores correctly: Core indices vary. 4-7 aren’t always Big Cores; some platforms use 0-3 as Big Cores.
- Respected CPUSETS: Binding only works within the process’s allowed
cpuset. Attempting to bind a thread to cores 4-7 when the process is restricted to 0-3 will fail or cause errors.
Cause 3: Poor Software Architecture Design
Runnable represents time spent in a CPU queue. Common sense says the longer the queue or more frequent the queuing, the higher the risk. Complex tasks spanning many threads (e.g., rendering) are more vulnerable because each thread transition adds a potential queuing delay.
If your programming model requires heavy orchestration between many threads (A hands off to B, A waits for B, B wakes A), any CPU congestion will amplify the “Runnable” wait at every handoff.
Optimization Strategies:
- Adjust priorities (see Cause 1).
- Optimize architecture to minimize cross-thread handoffs/wakes. Use Trace to visualize thread dependencies and CPU Profiler to inspect logic.
- Platform-level: Modify the scheduler to identify “thread groups” with dependency chains and prioritize them together.
Cause 4: High Application or System Load
If massive numbers of tasks are forced into a single core’s run queue, lower-priority tasks will inevitably wait longer.
In Perfetto/Systrace, check the CPU core view. If you see a dense, gapless sequence of tasks even after zooming in, the system load is likely high (CPU usage $>90%$). Select an interval and sort tasks by duration to see what is consuming the CPU.
Two main sources of high load:
1. High App-Specific Load
The App itself saturates the CPU by spawning dozens of threads simultaneously.
Optimization Suggestions:
- Identify high-usage threads and check for abnormal behavior.
- Optimize the load of the thread itself using
simpleperf. - Use a higher-priority scheduler (e.g.,
RT), but use caution as this introduces new risks. - Separate critical and non-critical threads. Bind non-critical threads to Small Cores or set low priorities; set high priorities for rendering threads. Assume a harsh environment—Android doesn’t guarantee your App exclusive resources.
2. High System Service Load
Some manufacturer ROMs have inefficient background services that consume excessive resources. Additionally, poor management might allow “rogue apps” to stay active in the background for sync/keep-alive operations.
3. Manufacturer “Magic” Technologies
Manufacturers can optimize resource allocation to favor foreground Apps:
- CPUSETS: Group threads by priority and restrict them to specific clusters. AOSP has this but with flaws:
- Many background tasks can still saturate all cores.
- Doesn’t always respect process states (Music, Navigation, etc.).
- Doesn’t manage sub-processes forked from Java processes well.
- CPUCTL: Set resource quotas (e.g., cap CPU usage for rogue or background processes).
- Freezing Technology: Freeze background processes to deny them CPU entirely (similar to iOS). Challenges include handling IPC, process relations, and compatibility.
- On-demand Startup: Tight control over system and background auto-starts.
Cause 5: CPU Capacity Limits, Throttling, and State Anomalies
Just like a queue at a clinic—fewer windows mean longer waits. Weak CPU power, core shutdowns, or frequency capping increase Runnable probability.
- Scenario-Based Control
- Different frequency/core policies for different modes.
- Locking frequencies/cores due to high temperature.
- Low Power Mode: e.g., Qualcomm’s LPM.
- C-State Transitions: Latency when switching from deep sleep (C2/C1) to active (C0).
- Hardware Failure: Rare but possible.
- Low-End Devices: Cheap CPUs with low compute power.
Observations:
- Scenario Control: This tests a manufacturer’s tuning. Apps should aim for lower load to avoid triggering platform restrictions. Manufacturers must balance power and performance per scenario.
- Thermal Throttling: See “Cause 5: Thermal Throttling” in Systrace Thread CPU State Analysis Tips - Running.
- Low-End Devices: Truly weak CPUs simply can’t process tasks as fast as flagship chips, leading to more queuing.
Cause 6: Scheduler Anomalies
While rare, scheduler bugs or misconfigured “governors” can cause tasks to pile up on a few cores while others are idle.
System developers should build robust “observability” to diagnose these fleeting issues that are difficult to reproduce.
Cause 7: 32-bit vs. 64-bit Process Handling
Transitionary chips (like Snapdragon 8 Gen 1 or Dimensity 9000) have strange restrictions. 32-bit Apps might be restricted to specific microarchitectures, while 64-bit Apps run freely. If your App is still 32-bit, its tasks might be forced onto a subset of cores, increasing Runnable congestion.
- App Developers: Upgrade to 64-bit immediately.
- System Developers: Identify legacy Apps and optimize background management to reduce their load.
About Me && Blog
Below is my personal intro and related links. I look forward to exchanging ideas with fellow professionals. “When three walk together, one can always be my teacher!”
- Blogger Intro
- Blog Content Navigation: A guide for my blog content.
- Curated Excellent Blog Articles - Android Performance Optimization Must-Knows
- Android Performance Optimization Knowledge Planet
One walks faster alone, but a group walks further together.