Different people have different understandings of smoothness (jank/dropped frames) and different perceptions of jitter thresholds. Therefore, before starting this series, it is necessary to clarify the content to avoid misunderstandings. Here are some basic explanations:
- For mobile users, jank encompasses many scenarios: dropped frames when scrolling lists, excessive white screen during app startup, slow screen wake-up when pressing the power button, unresponsive interface followed by a crash, no response when clicking an icon, incoherent window animations, lagging touch response, or stuttering when entering the desktop after a reboot. These scenarios differ slightly from what developers understand as “jank.” Developers categorize these more finely, which is a cognitive gap between developers and users that must be noted when handling feedback from users or testers.
- For developers, the above scenarios fall into three major categories: Smoothness (dropped frames in lists, incoherent animations, stuttering desktop entry), Responsiveness (long startup white screens, slow screen wake-up, lagging touch), and Stability (unresponsive interface/crashes, no response to icon clicks). This classification is used because each category requires different analysis methods and steps. Quickly identifying the category is crucial.
- Technically, Smoothness, Responsiveness, and Stability (ANR) all feel like “jank” to users because their underlying principles are identical: the main thread’s Message exceeds its processing deadline. They are simply categorized by different timeout thresholds. Understanding these problems requires knowledge of basic system operation mechanisms, which this article will introduce.
- This series primarily analyzes smoothness-related issues. Responsiveness and stability will be covered in dedicated articles. Understanding smoothness first will make analyzing responsiveness and stability much easier.
- This series focuses on using Systrace (Perfetto) for analysis. Systrace is our entry point because many factors affect smoothness—some within the app itself and others within the system. Systrace (Perfetto) provides a holistic view of the system’s operation during the problem, helping us initially pinpoint the root cause.
Table of Contents
- The Routine for Analyzing Jank with Systrace
- Case Study: Analyzing Jank with Systrace
- Case Description
- What Role Does Triple Buffer Play in This Scenario?
- Series Articles
- Attachments
- About Me && Blog
Systrace Series Articles:
- Introduction to Systrace
- Systrace Basics - Prerequisites for Systrace
- Systrace Basics - Why 60 fps?
- Android Systrace Basics - SystemServer Explained
- Systrace Basics - SurfaceFlinger Explained
- Systrace Basics - Input Explained
- Systrace Basics - Vsync Explained
- Systrace Basics - Vsync-App: Detailed Explanation of Choreographer-Based Rendering Mechanism
- Systrace Basics - MainThread and RenderThread Explained
- Systrace Basics - Binder and Lock Contention Explained
- Systrace Basics - Triple Buffer Explained
- Systrace Basics - CPU Info Explained
- Systrace Smoothness in Action 1: Understanding Jank Principles
- Systrace Smoothness in Action 2: Case Analysis - MIUI Launcher Scroll Jank Analysis
- Systrace Smoothness in Action 3: FAQs During Jank Analysis
- Systrace Responsiveness in Action 1: Understanding Responsiveness Principles
- Systrace Responsiveness in Action 2: Responsiveness Analysis - Using App Startup as an Example
- Systrace Responsiveness in Action 3: Extended Knowledge on Responsiveness
- Systrace Thread CPU State Analysis Tips - Runnable
- Systrace Thread CPU State Analysis Tips - Running
- Systrace Thread CPU State Analysis Tips - Sleep and Uninterruptible Sleep
If you are not familiar with the basic use of Systrace (Perfetto), please catch up on the Systrace Basics Series first. This article assumes you are already familiar with using Systrace (Perfetto).
The Routine for Analyzing Jank with Systrace
The general workflow for using Systrace to analyze jank is as follows:
Reproduce the jank scenario and capture a Systrace using shell or built-in tools.
Open the captured
trace.htmldirectly in Chrome.- If it doesn’t open directly, type
chrome://tracing/in Chrome and drag the file onto the page. - Alternatively, use Perfetto View and select “Open With Legacy UI.”
- If it doesn’t open directly, type
Understand the context of the problem to improve analysis efficiency.
- User (or tester) operation steps.
- Reproduction probability.
- Whether competitor devices exhibit the same jank.
Before or during analysis, check the Systrace for basic info:
- CPU frequency, architecture, Boost info, etc.
- Thermal throttling: Manifests as suppressed CPU frequencies.
- High load scenarios: Manifests as very dense tasks in CPU zones.
- Low memory scenarios: Manifests as busy
lmkd, slowHeapTaskDeamonin the App process, or many Block IOs.
Locate the App process in Systrace.
The first thing to look at is the App process, specifically the UI thread and Render thread. Find time-consuming frames. E.g., the red box below shows a UI Thread taking 110ms—clearly abnormal (from a Bilibili list scroll jank case).
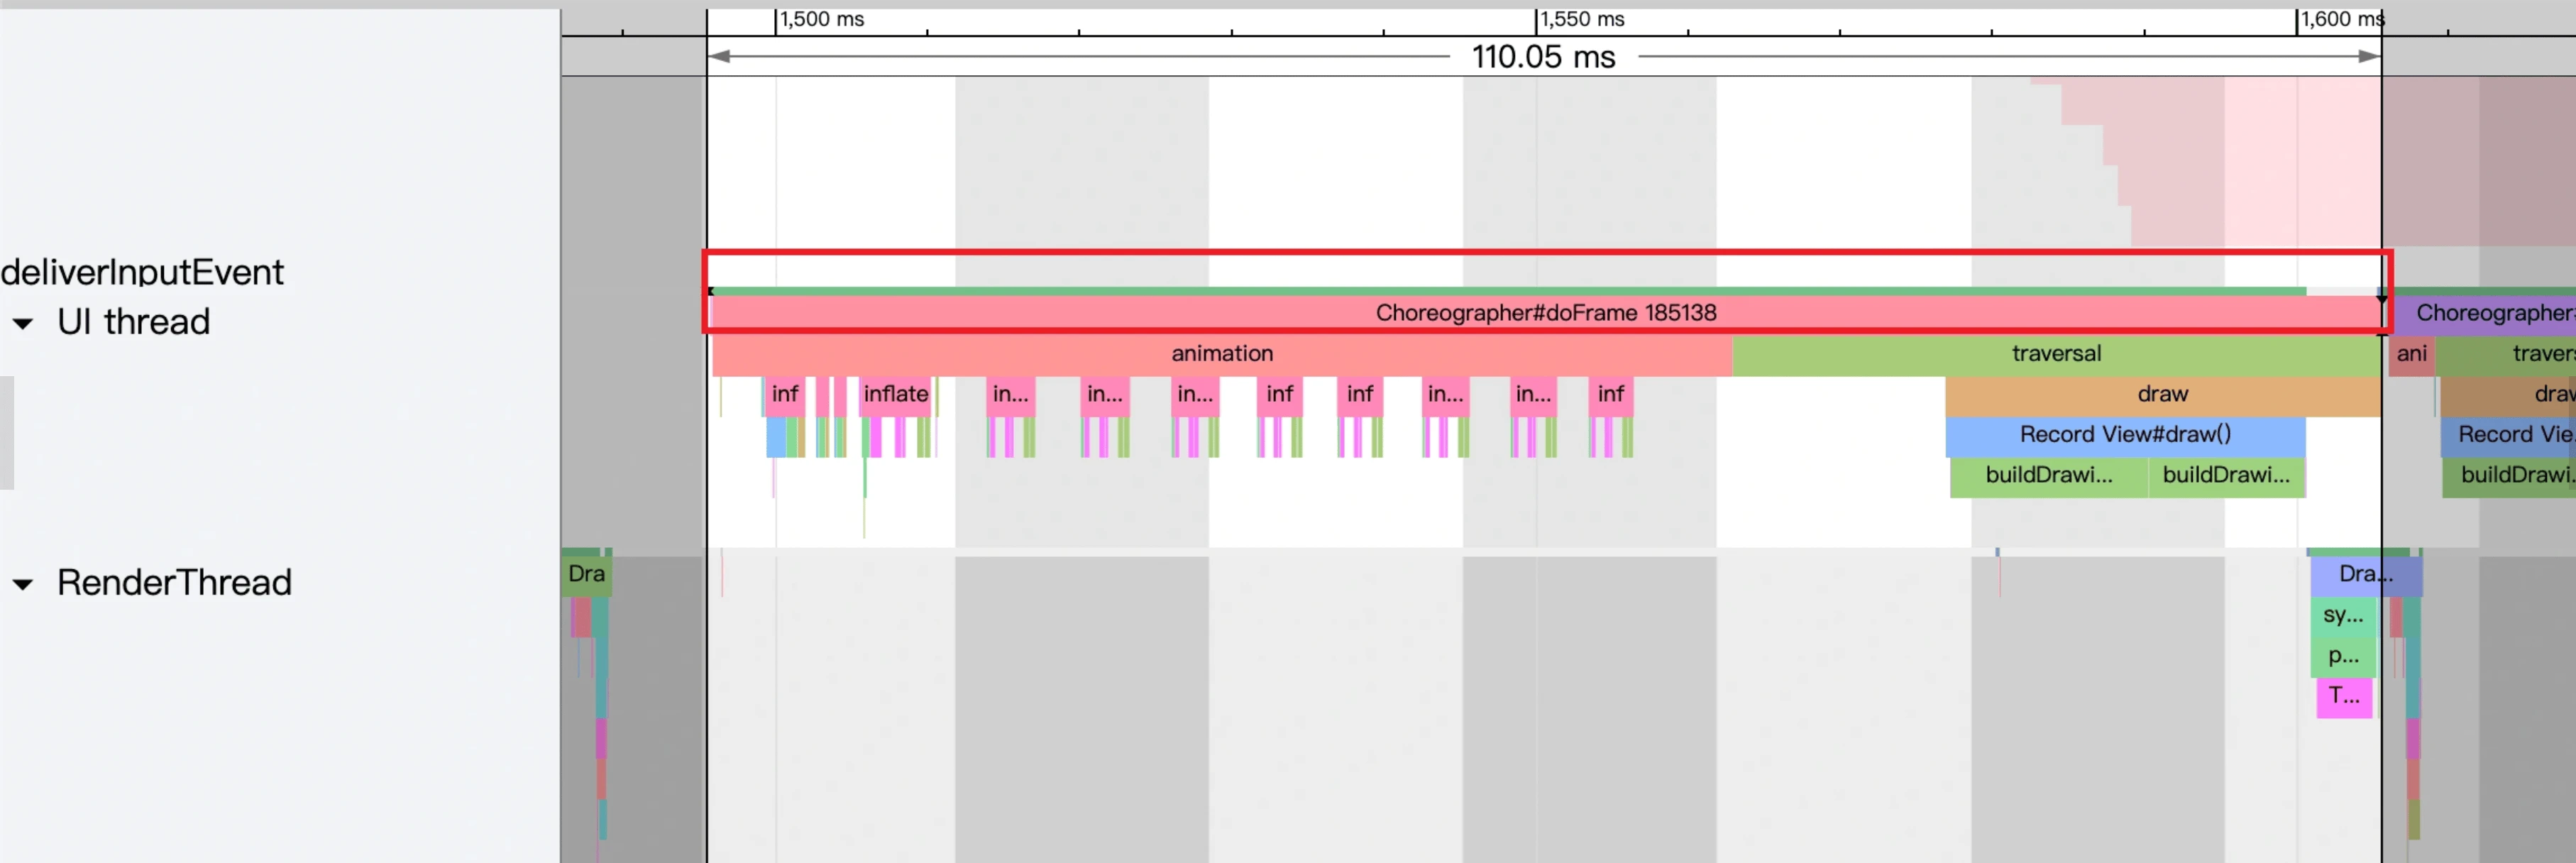
In fact, any
doFramethat exceeds a Vsync cycle (Yellow and Red frames) needs checking for actual jank. Even without jank, look for reasons. E.g.:
Vsync cycle vs. Refresh rate:
- 60fps: 16.6ms cycle.
- 90fps: 11.1ms cycle.
- 120fps: 8.3ms cycle.
Analyze the SurfaceFlinger process’s Main thread and Binder thread.
Due to multiple buffer mechanisms, the App main/render threads might exceed a cycle without causing jank. Check
SurfaceFlinger‘s Main thread to confirm. E.g., for the 110ms app frame above, the SF Main thread looks like this: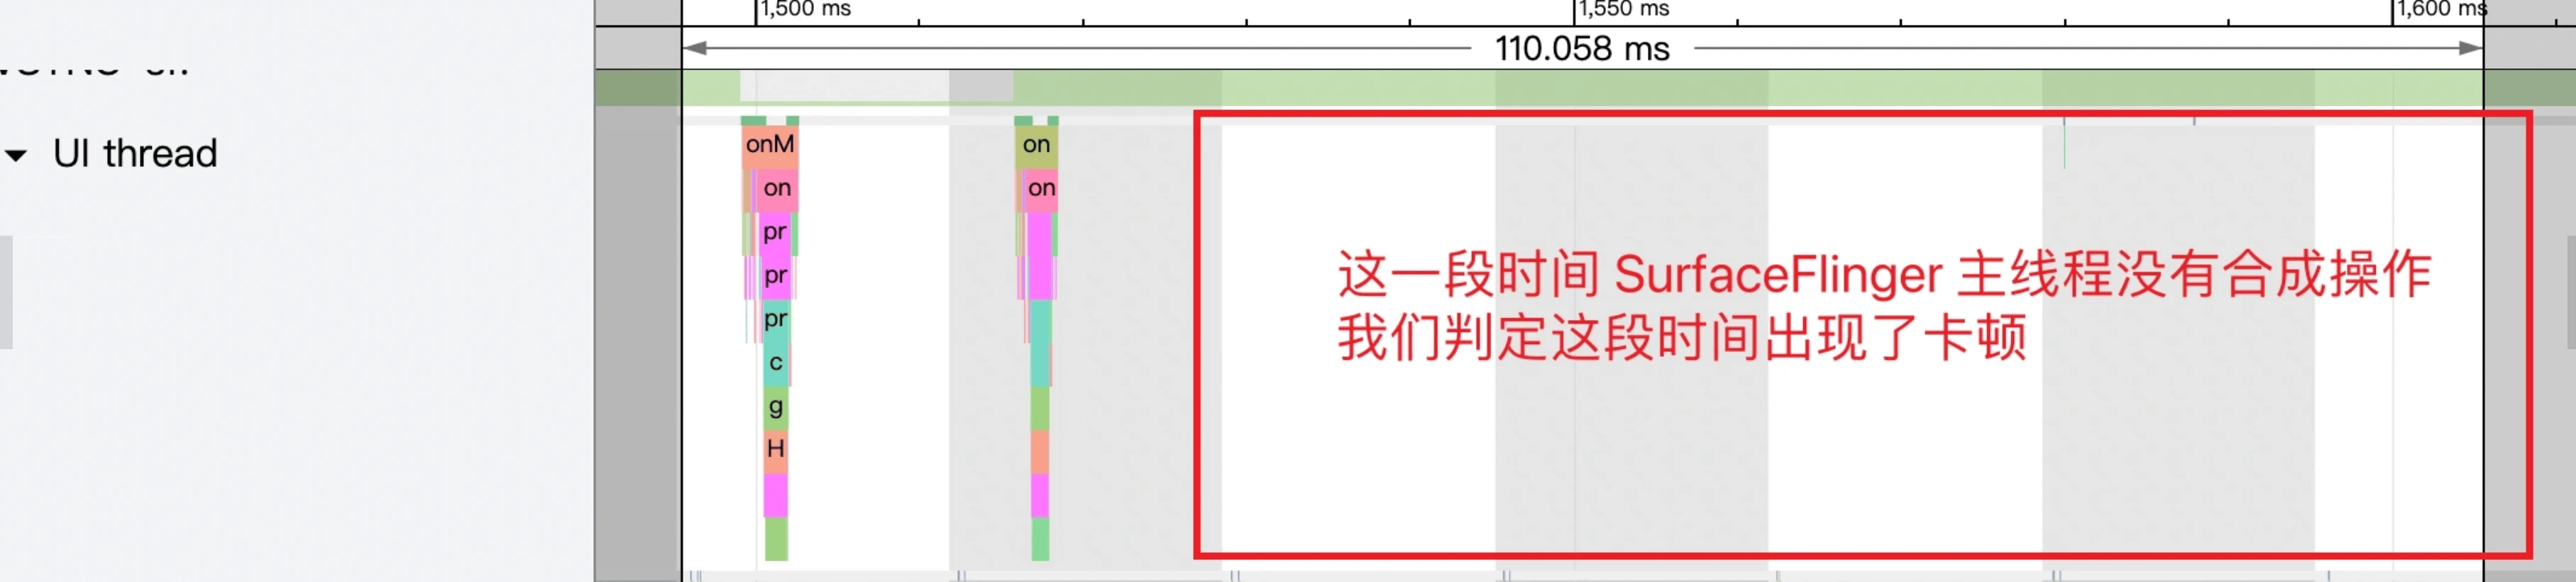
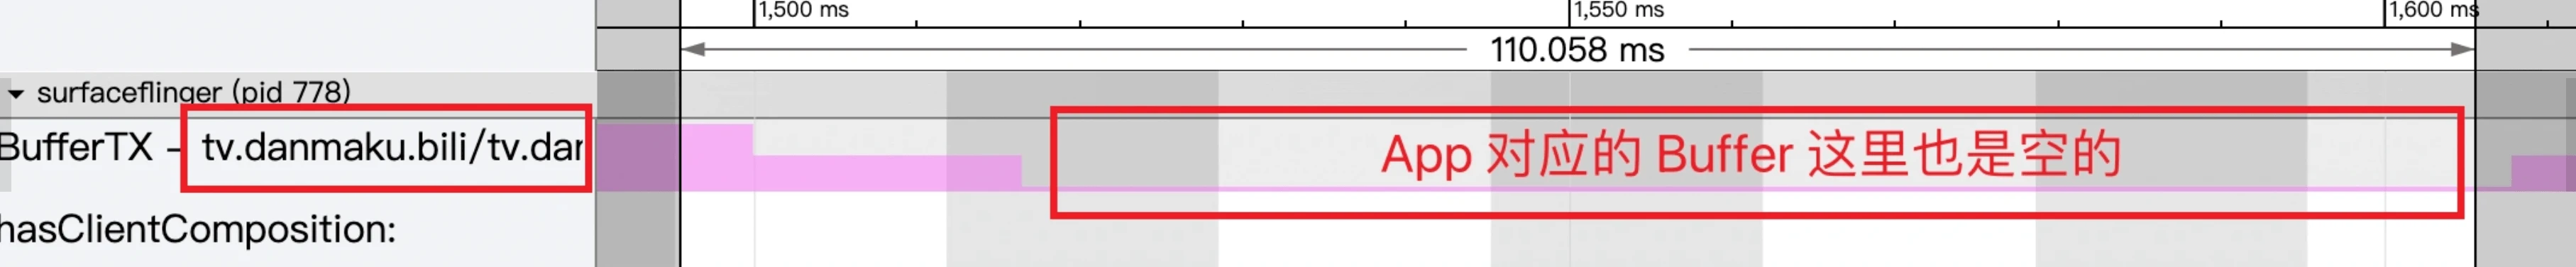
The App’s Buffer count in the SF process area is also empty:
System-wide and Binder call analysis (optional).
- In the Bilibili case, the bottleneck is clearly within the App itself. Optimizing the relevant View or logic would suffice.
- Sometimes the App UI thread is slow due to excessive
Runnablestates or Binder call timeouts, which requires system-wide analysis to find the root cause.
After following this routine, cross-reference data across processes to infer the most likely cause.
App frame drops have many causes. Refer to these articles; different causes have distinct Systrace signatures:
- Overview of Jank Causes in Android - Methodology
- Overview of Jank Causes in Android - System Side
- Overview of Jank Causes in Android - App Side
- Overview of Jank Causes in Android - Low Memory Side
Case Study: Analyzing Jank with Systrace
Systrace is the primary tool for analyzing jank, providing a global view to determine if jank is system-driven or app-specific.
However, for deeper analysis, Systrace can be limited. It often needs to be paired with TraceView and source code to pinpoint and solve issues, and then verified again with Systrace.
This article focuses on discovery and analysis. Solutions (like optimizing logic, scheduling, or layout) must be tailored to findings.
Case Description
On my Mi 10 Pro, I often felt a stutter during the common gesture of swiping the desktop. Since the Mi 10 Pro has a 90Hz screen and 90 FPS target, jank is very noticeable. After upgrading to MIUI 12.5, the issue remained, so I decided to investigate.
The captured Systrace revealed a perfect case study for smoothness analysis.
I recommend downloading the attached Systrace and following along with the article.
- Because many factors affect jank, I’ll clarify the hardware and software versions first. Findings apply to the attached Systrace even if the scenario is optimized later.
- Hardware: Mi 10 Pro
- Software: MIUI 12.5.3 Stable
- Launcher Version: RELEASE-4.21.11.2922-03151646
Starting with Input events
In the captured Systrace, I performed only one swipe, making it easy to locate. The input sequence consists of one Input Down, several Input Moves, and one Input Up.
In Systrace, we see InputDispatcher and InputReader threads in SystemServer, but we primarily focus on the App UI thread.
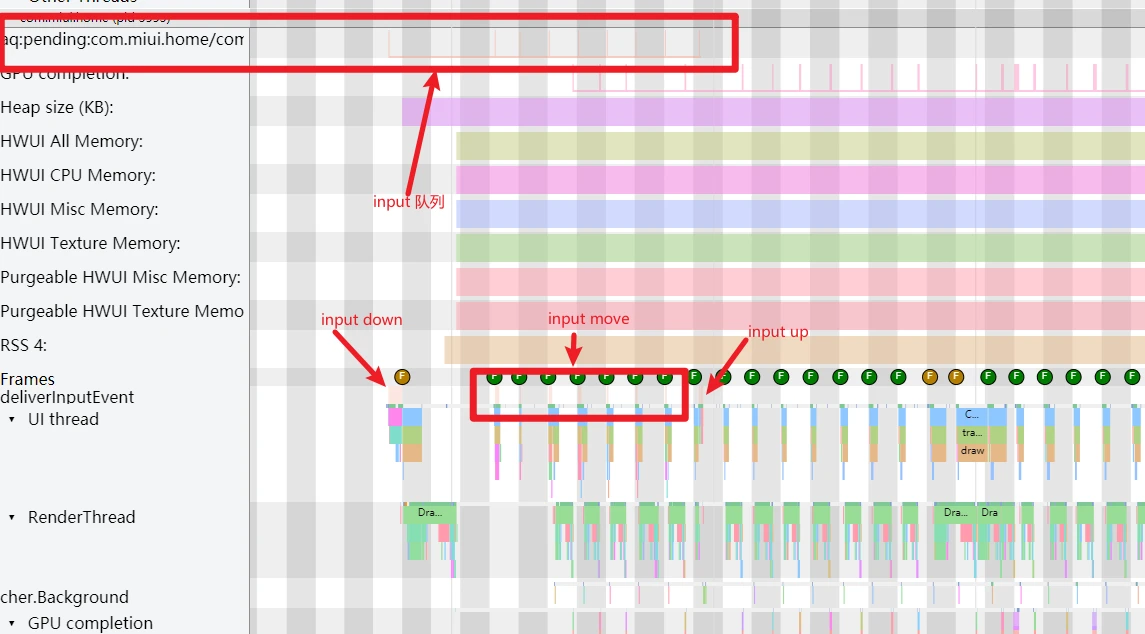
As shown above, deliverInputEvent on the App UI thread marks input processing. After “Input Up,” the “Fling” phase begins. Basics:
Analyzing the UI Thread
Since this jank mostly occurred after releasing the finger, we focus on the segment after “Input Up.”
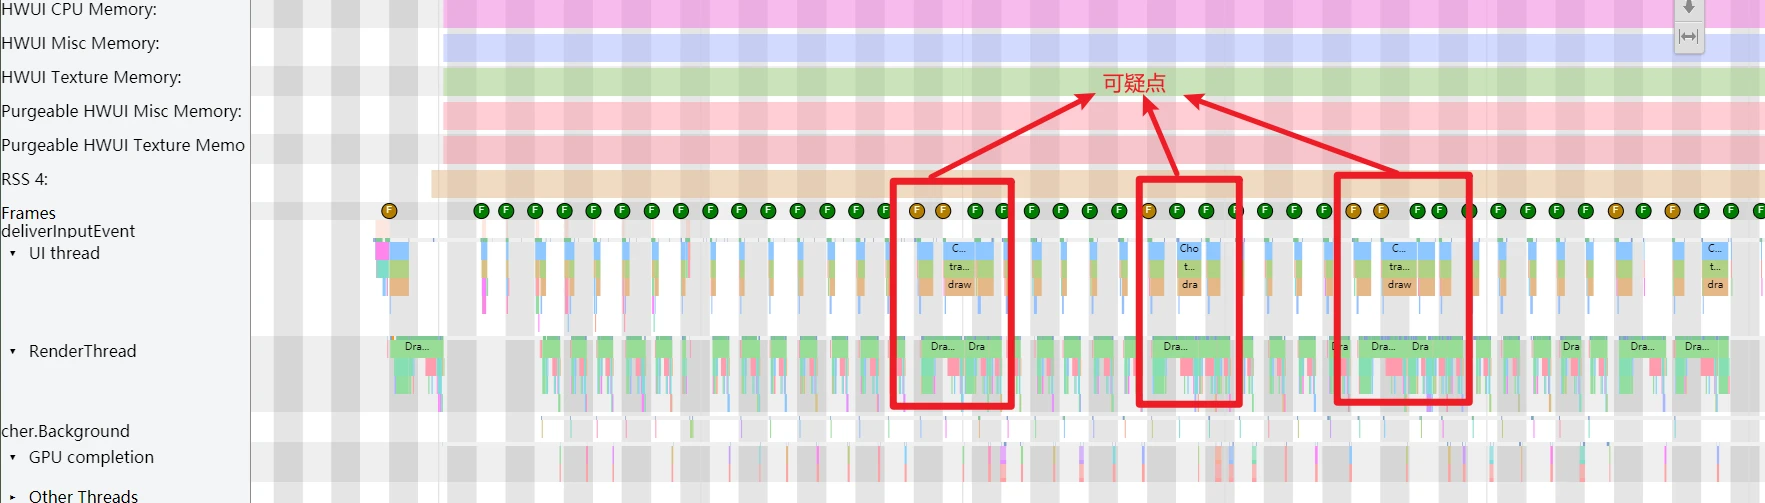
UI thread frames are color-coded: Green, Yellow, Red. In this trace, there are no red frames, only green and yellow. Is a yellow frame always a jank? Not necessarily. We can’t confirm jank from the UI thread alone.
Identifying three suspicious points, we move to the RenderThread.
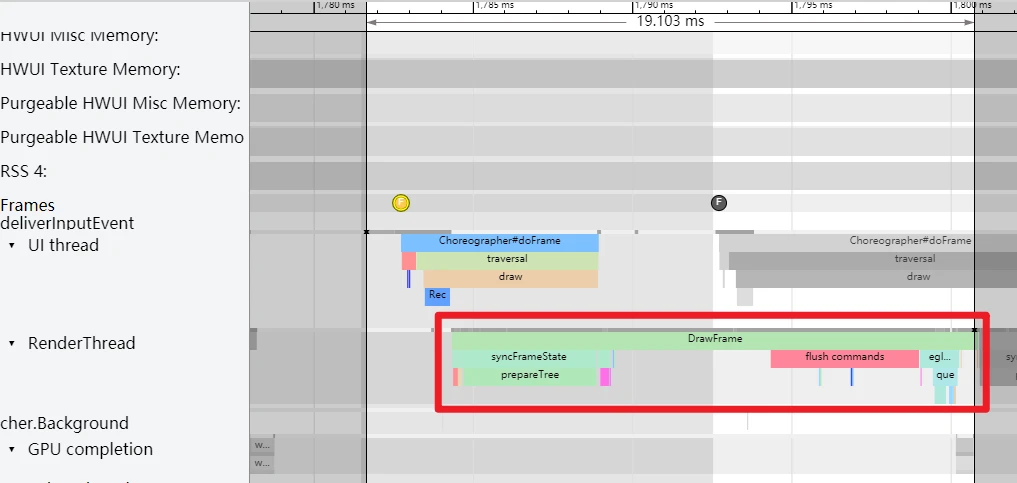
Analyzing the Render Thread
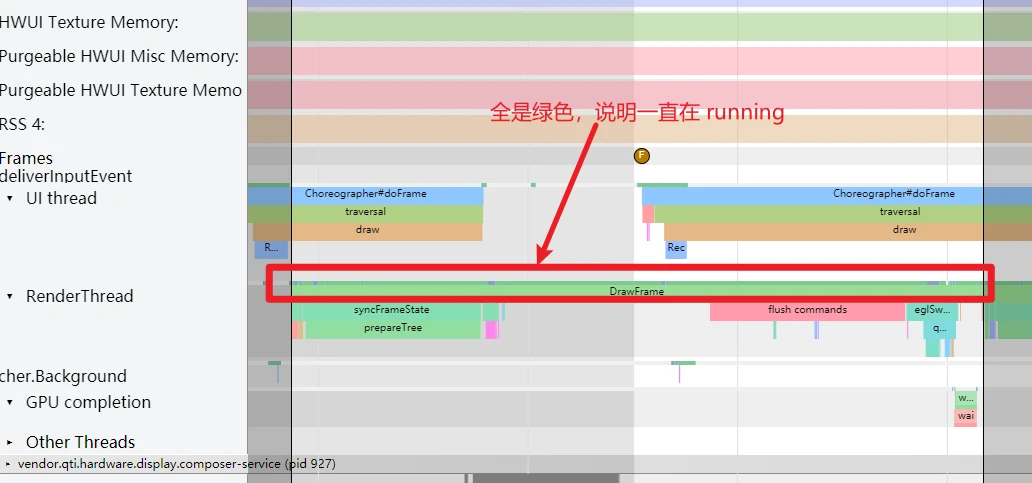
Zooming into the first suspicious point: total frame time is 19ms, with RenderThread taking 16ms. The RenderThread CPU state is “Running” (green). This delay is likely due to:
- RenderThread is busy with heavy tasks.
- RenderThread performance is bottlenecked by the CPU (low frequency or small cores).
Before looking at the CPU, we check SurfaceFlinger to confirm actual jank.
Analyzing SurfaceFlinger
For basics on SF trace reading, see SurfaceFlinger Explained.
We focus on two points:
- Buffer status in the App’s
BufferQueue. DoesSurfaceFlingerhave a buffer available from the app? SurfaceFlingerMain thread composition. If SF-vsync arrives and composition occurs, was it for our app?
Criteria for Judging Jank:
If SF has no composition task and the App worked during that cycle but provided no Buffer to
BufferQueue, jank occurred.
(Matches the first suspicious point).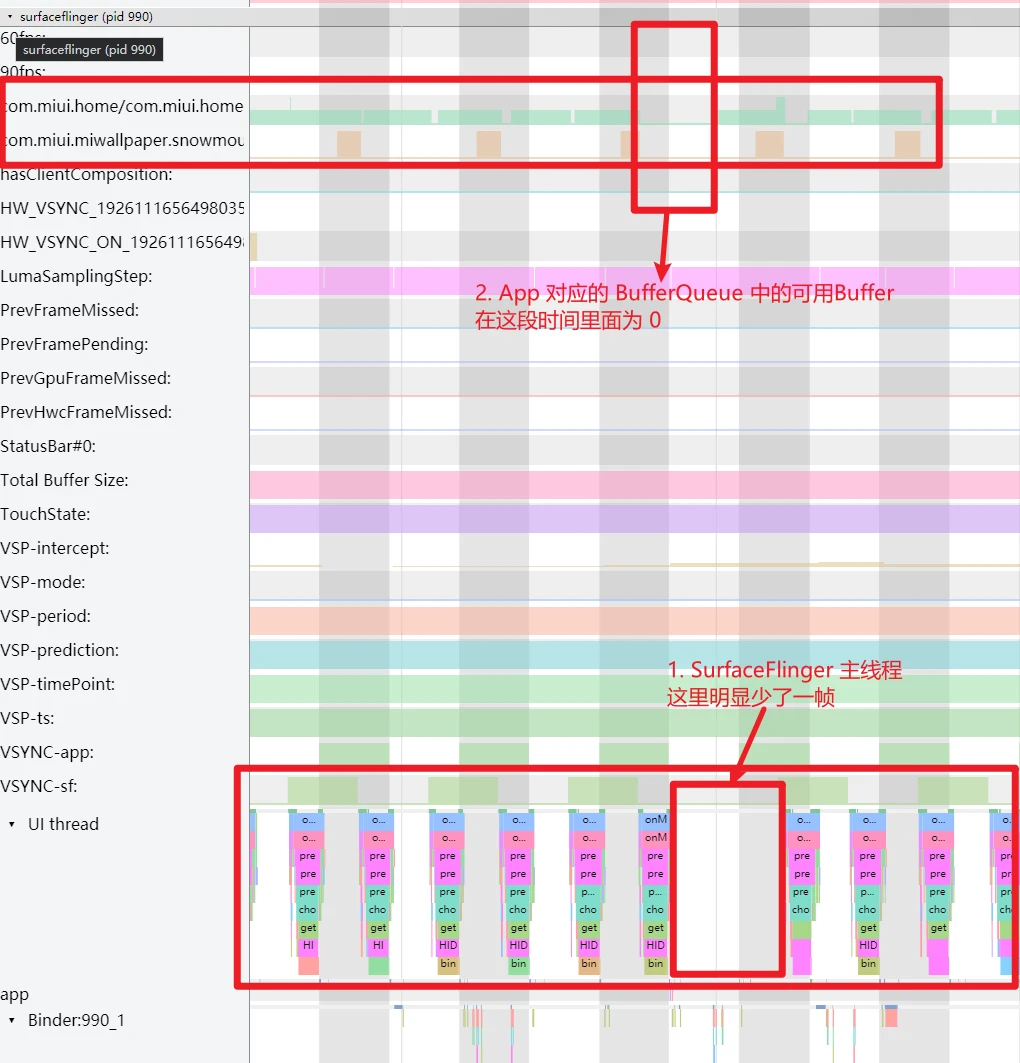
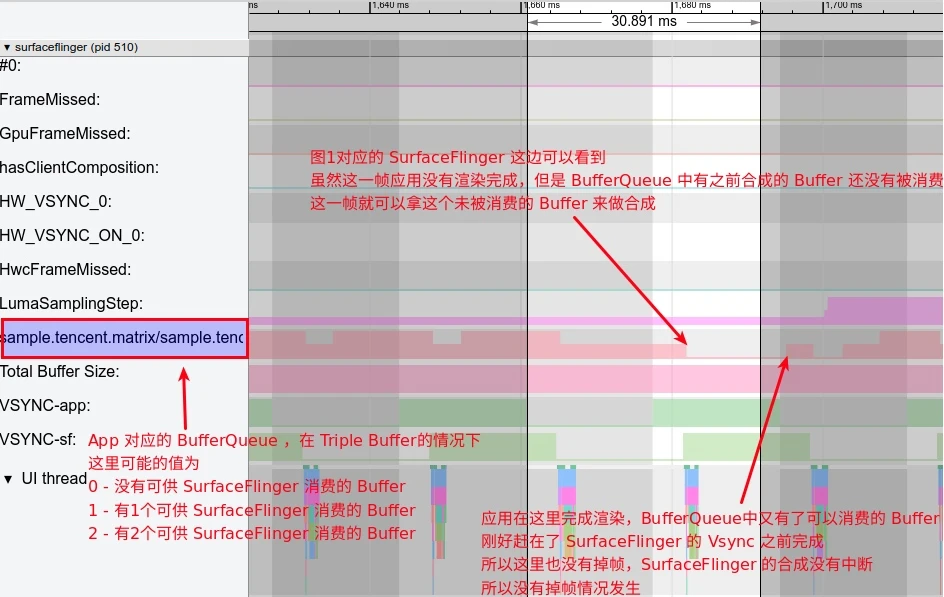
If SF performs composition but our App’s
BufferQueueis empty, jank still occurred for our App. SF likely composited other layers.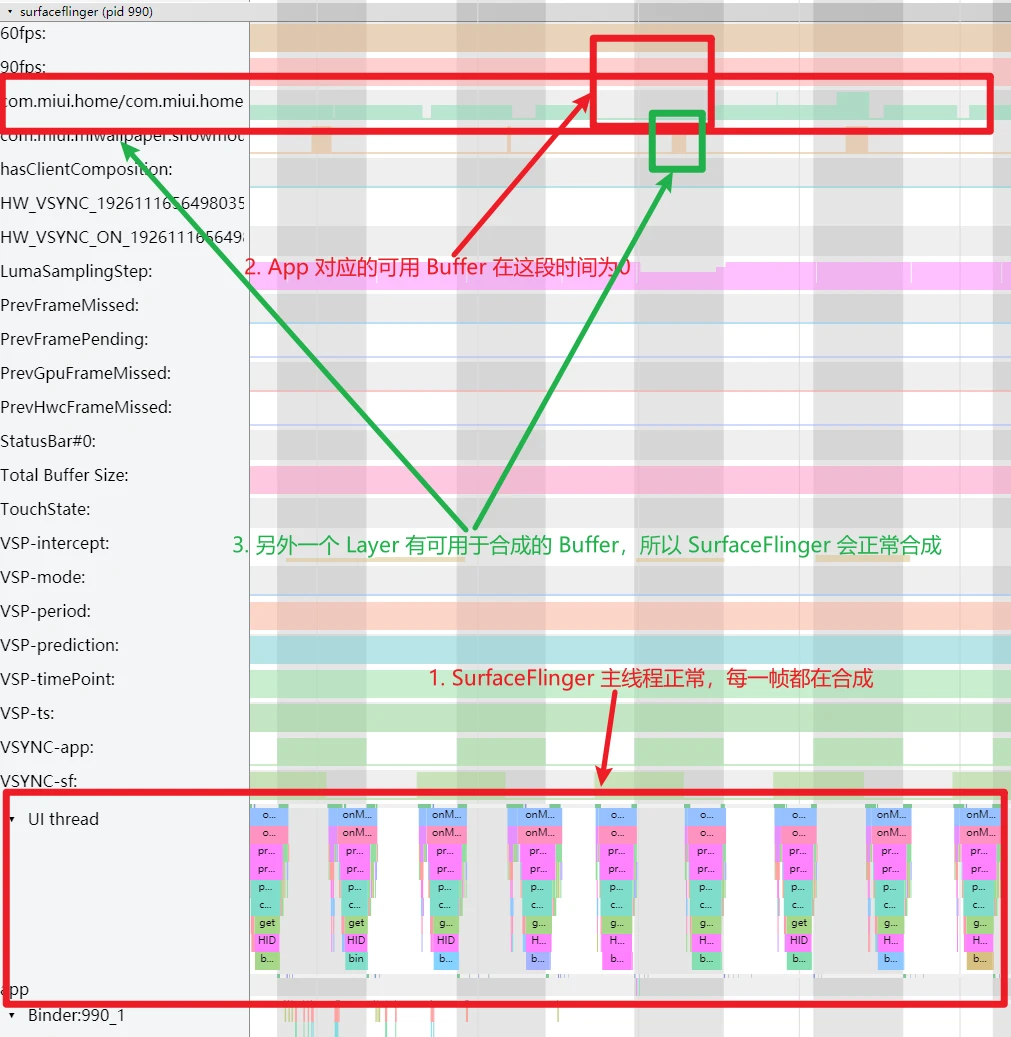
If SF performs composition and our App has a Buffer available, everything is normal.
(Provided for comparison).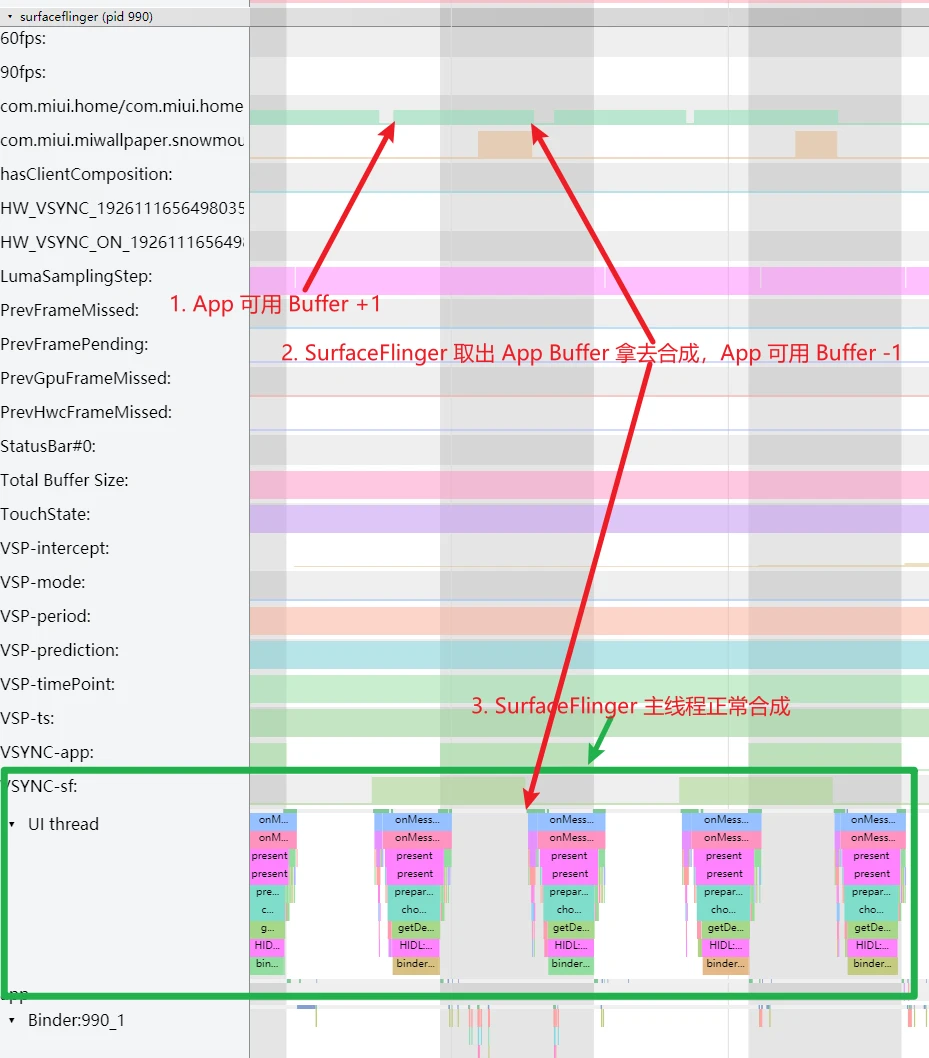
At the first suspicious point, SF confirms a frame was dropped because the App didn’t provide a Buffer. Why?
Back to the Render Thread
The 19ms total frame time (16ms in RenderThread) is unusual for a low-load scenario like desktop scrolling, especially since the previous frame was 3x faster. This isn’t a task load issue.
Check the RenderThread CPU info:
Since it’s “Running,” we check the Kernel area for scheduling details.
Analyzing CPU Info
See CPU Info Explained and Prerequisites for Systrace.
In this case, the RenderThread is mostly on CPUs 0 and 2—the Small Cores of the Snapdragon 865 (which has 4 Small, 3 Big, and 1 Prime core).
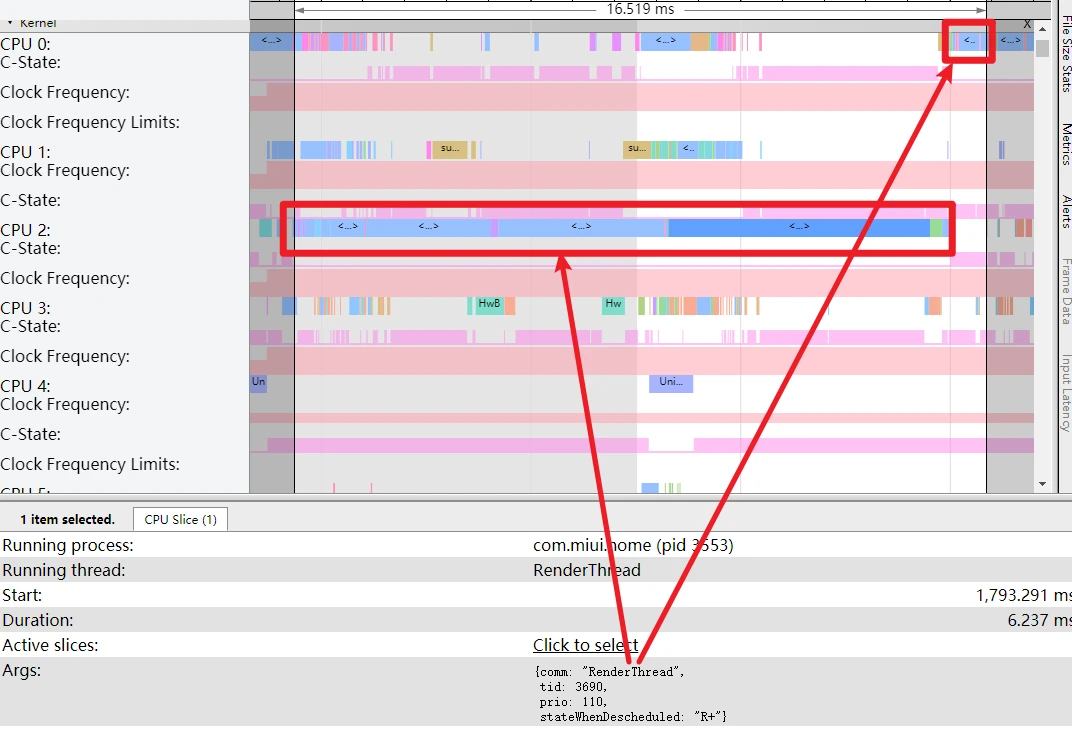
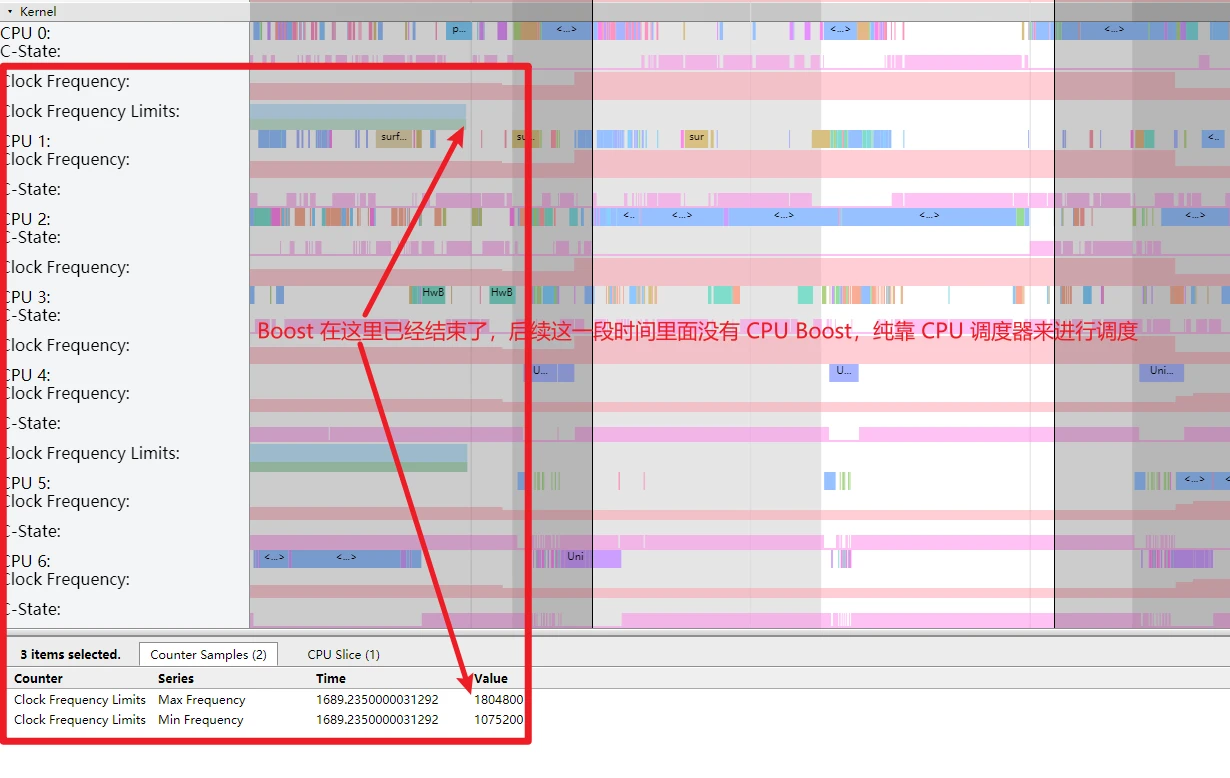
The frequency is capped at 1.8GHz (Small core max).
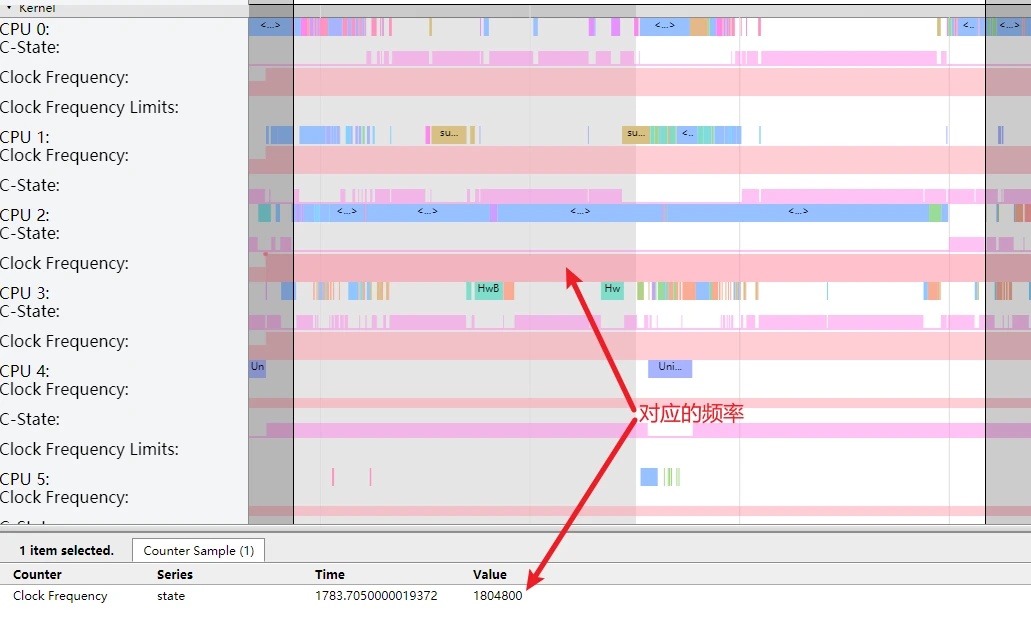
And there’s no CPU Boost active.
Hypothesis: Small cores even at max frequency can’t finish the task in time. Validation steps:
- Are normal frames also on small cores? (If yes without jank, the hypothesis is wrong).
- Are other janky frames also caused by small core scheduling?
Analysis reveals:
- Normal frames are NOT on small cores. After a jank, the scheduler immediately moves RenderThread back to big cores.
- Every janky frame was caused by RenderThread being scheduled on small cores which lacked the performance to finish on time.
Cause found: RenderThread being scheduled on Small Cores.
Scheduling is controlled by complexity algorithms based on task load. Optimizations:
- Adjust core migration thresholds or scheduler algorithms.
- Compare competitor strategies and scheduling indicators in similar scenarios.
What Role Does Triple Buffer Play in This Scenario?
In Triple Buffer Explained, we noted it helps:
- Mitigate jank.
- Reduce wait times.
- Lower bottlenecks.
However, in this Mi Launcher case, it sometimes had a negative impact, worsening the perceived jank:
See the Mitigating Jank principle:
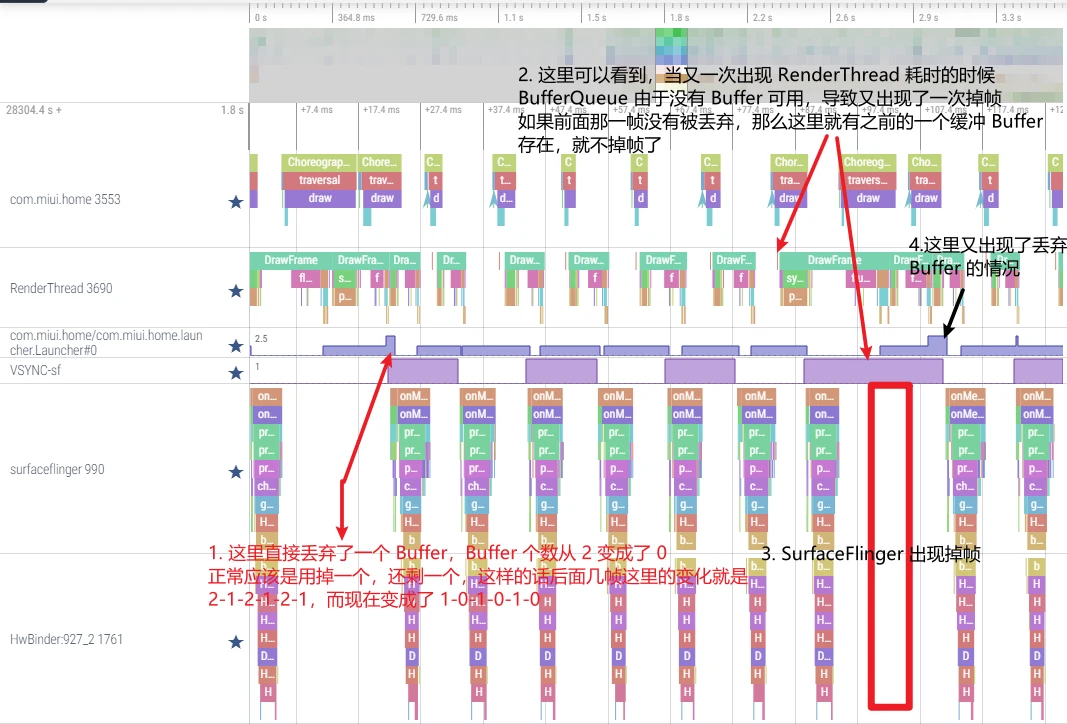
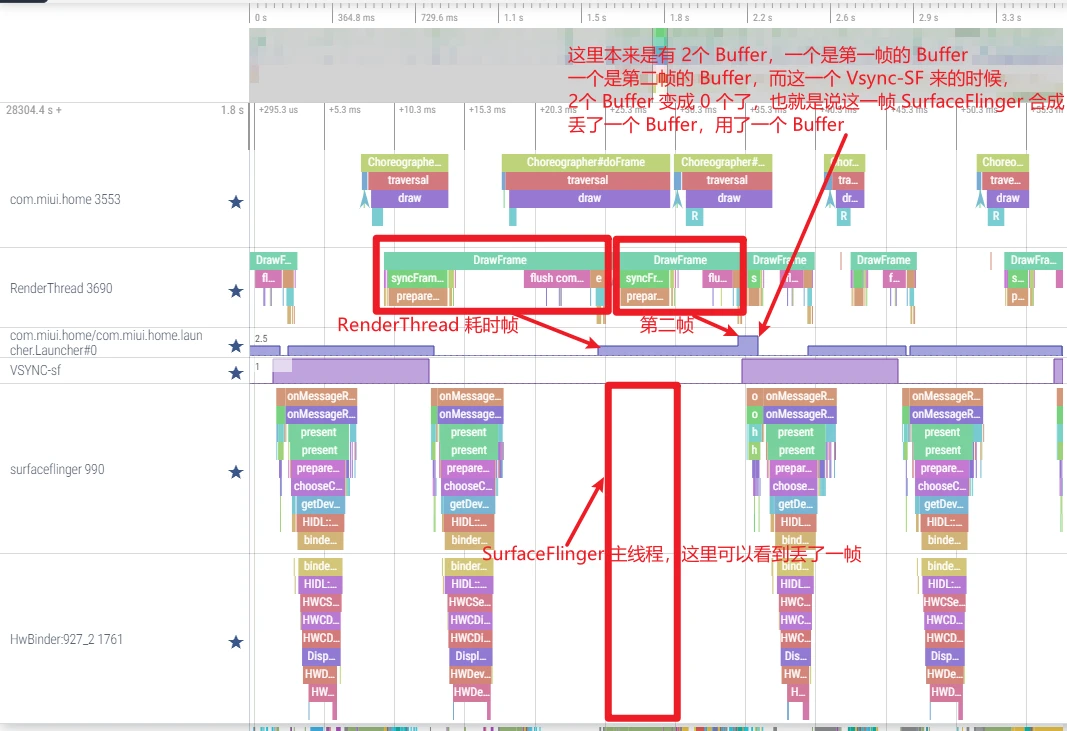
In the Mi Launcher trace, the BufferQueue sometimes dropped from 2 available buffers to 0, effectively discarding a buffer:
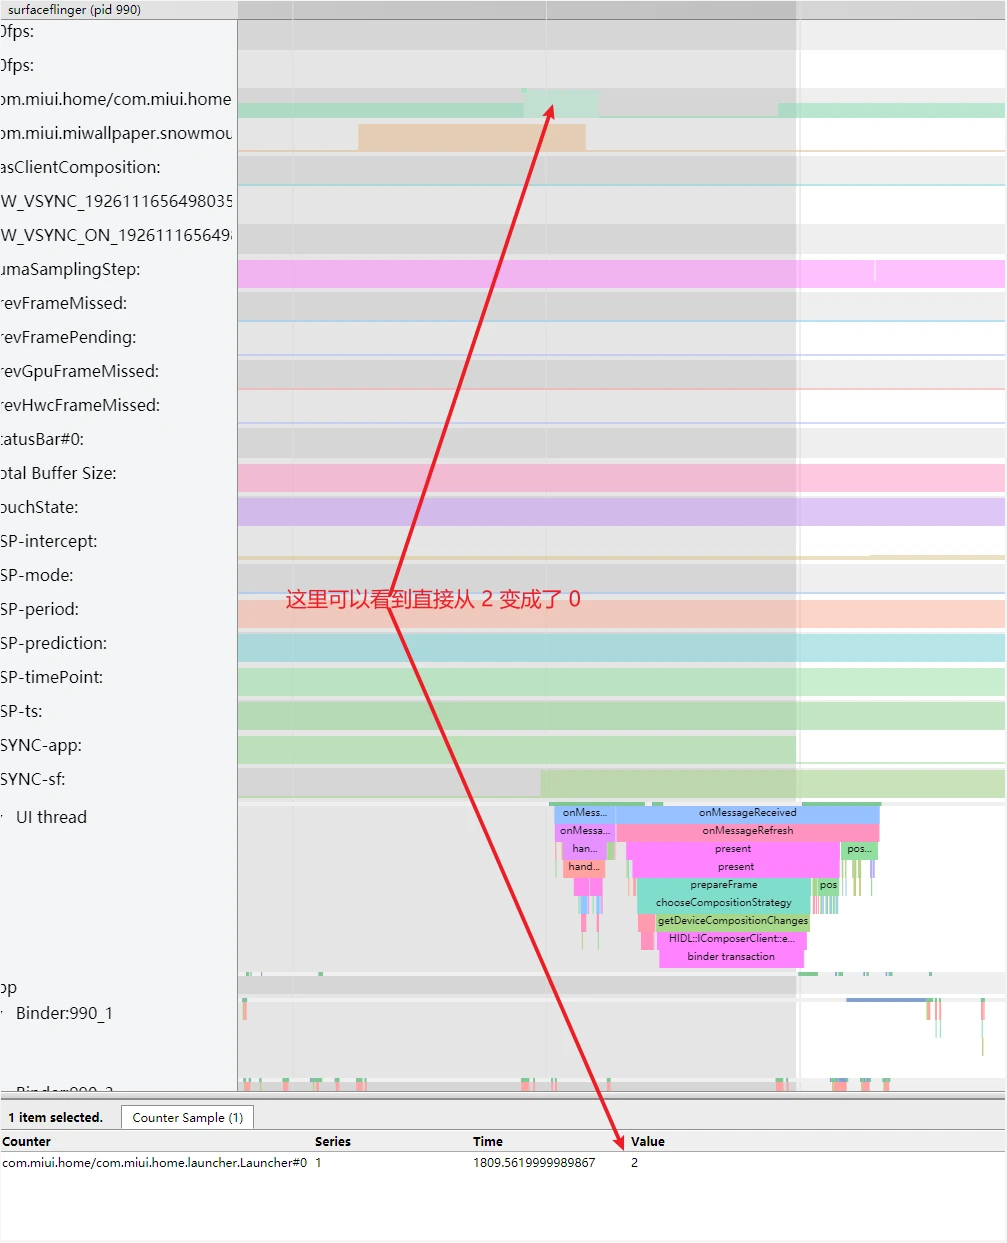
If a subsequent RenderThread timeout occurs during a Fling, no spare buffer is left to cushion it, resulting in an immediate jank. Triple buffering’s mitigation effect is lost.
Furthermore, since Fling offsets are pre-calculated, discarding a frame buffer causes a visual “jump”:
Example with scrolling offsets:
- Normal:
2→4→6→8→10→12 - Dropped (cushioned):
2→4→6→6→8→10→12(Frame “8” delayed, user sees “6” twice—smooth decay). - Discarded:
2→4→6→6→10→12(Frame “8” discarded, jumps from “6” to “10”—feels like a jank + a jump).
Series Articles
- Systrace Smoothness in Action 1: Understanding Jank Principles
- Systrace Smoothness in Action 2: Case Analysis - MIUI Launcher Scroll Jank Analysis
- Systrace Smoothness in Action 3: FAQs During Jank Analysis
Attachments
Attachments are on GitHub: https://github.com/Gracker/SystraceForBlog/tree/master/Android_Systrace_Smooth_In_Action
xiaomi_launcher.zip: Main analysis trace.xiaomi_launcher_scroll_all_the_time.zip: Continuous scrolling trace.oppo_launcher_scroll.zip: Comparison trace.
About Me && Blog
Below is my personal intro and related links. I look forward to exchanging ideas with fellow professionals. “When three walk together, one can always be my teacher!”
- Blogger Intro: Includes personal WeChat and WeChat group links.
- Blog Content Navigation: A guide for my blog content.
- Curated Excellent Blog Articles - Android Performance Optimization Must-Knows: Welcome to recommend projects/articles.
- Android Performance Optimization Knowledge Planet: Welcome to join and thank you for your support~
One walks faster alone, but a group walks further together.