In the Overview of Jank and Frame Drops in Android - System Layer article, we touched upon jank cases caused by low system memory. Since low memory has a significant impact on overall device performance, I’m dedicating this article to exploring those effects in depth.
As Android versions evolve and apps become more feature-heavy, their memory requirements increase. However, many devices with 4GB of RAM or less are still in use. These users are prone to low memory situations, especially after major system updates or as they install more apps.
Low memory triggers performance issues categorized by slow responsiveness and jank. Examples include longer app launch times, more frame drops in scrolling, more frequent cold starts as background processes are killed, and increased device temperature. Below, I’ll outline the causes, debugging methods, and potential optimizations for these issues.
- Overview of Jank and Frame Drops in Android - Methodology
- Overview of Jank and Frame Drops in Android - System Layer
- Overview of Jank and Frame Drops in Android - Application Layer
- Overview of Jank and Frame Drops in Android - Low Memory
Identifying Low Memory
Meminfo Data
The simplest way is using dumpsys meminfo:
1 | adb shell dumpsys meminfo |
Signs of low memory:
Free RAMis very low, whileUsed RAMis very high.ZRAMusage is high (if enabled).
LMK and kswapd Activity
During low memory, the Low Memory Killer Daemon (LMKD) becomes active. You’ll see kill messages in the Kernel Log:
1 | [kswapd0] lowmemorykiller: Killing 'u.mzsyncservice' (15609) (tgid 15609), adj 906, |
This means kswapd0 killed a process because memory fell below the threshold for an OOM score of 900.
/proc/meminfo
This is how the Linux kernel exposes memory stats. When memory is low, MemFree and MemAvailable will be minimal.
System-wide Lag & Slow Response
When the system is in a low memory state, the entire device feels much more sluggish compared to normal memory conditions. Clicking on apps or launching applications will feel unresponsive or slow.
Impact of Low Memory on Performance
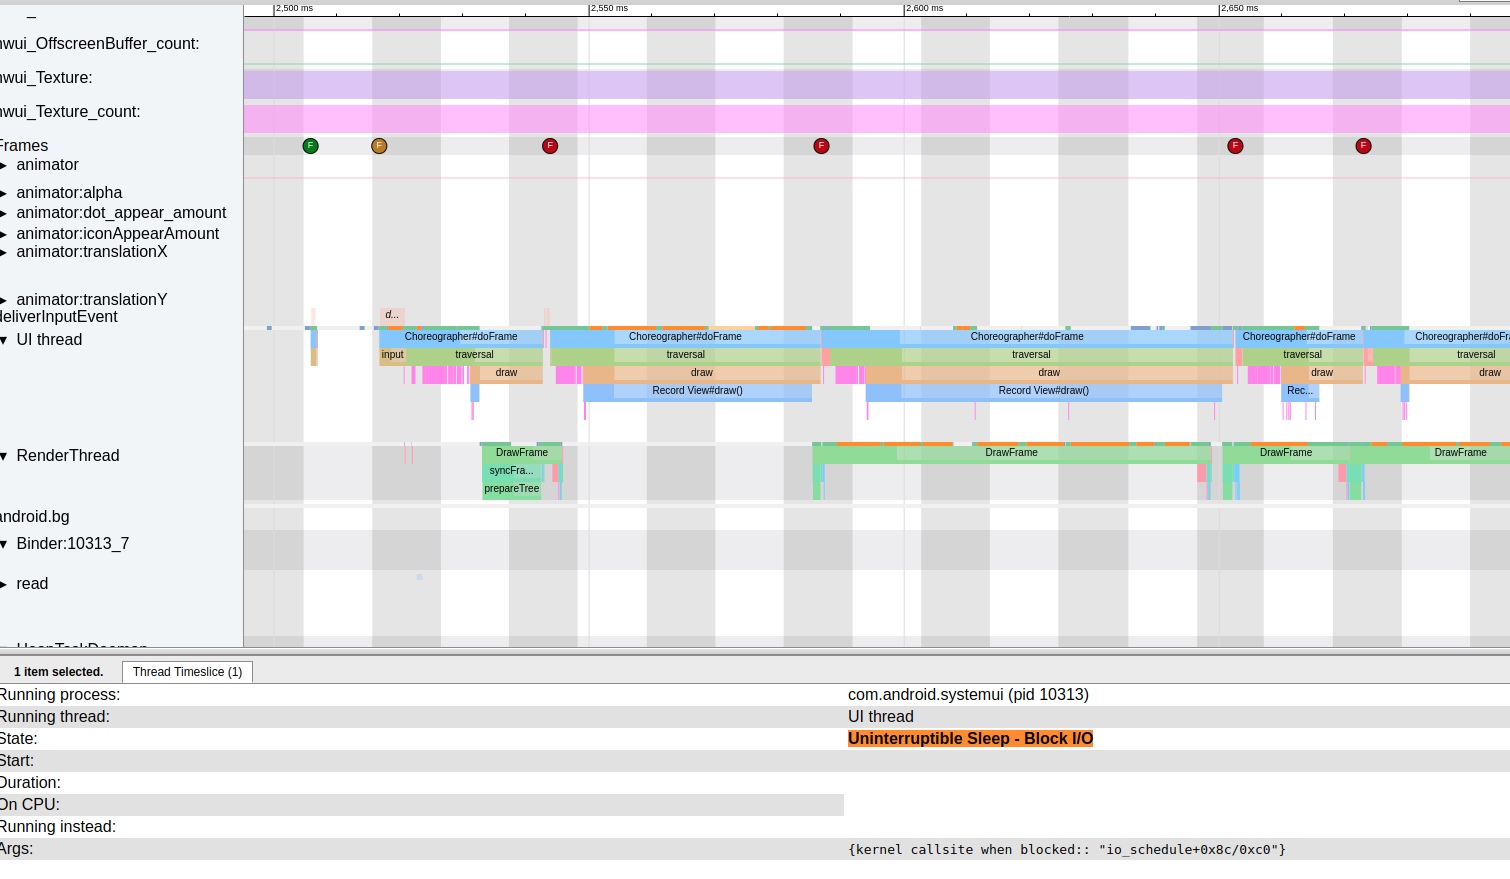
Main Thread I/O Latency
Low memory causes significant I/O issues.
- In a Systrace, this appears as many yellow/orange thread states:
Uninterruptible Sleep | WakeKill - Block I/O. - Block sites usually look like:
wait_on_page_bit_killable+0x78/0x88.
The Linux page cache chain sometimes contains pages that aren’t ready (content hasn’t been fully read from disk). If a user accesses such a page, it blocks on wait_on_page_locked_killable. Under heavy I/O, these I/O operations queue up, leading to long block durations.
When I/O is heavy, app operations involving disk access (loading views, reading files, configs, or odex files) trigger Uninterruptible Sleep, significantly slowing down the app.
CPU Contention
Low memory forces the Low Memory Killer to scan and kill processes frequently. kswapd0 (a kernel worker thread) wakes up to perform memory reclamation. If memory sticks near low levels, kswapd0 remains active, consuming CPU cycles and generating heat.
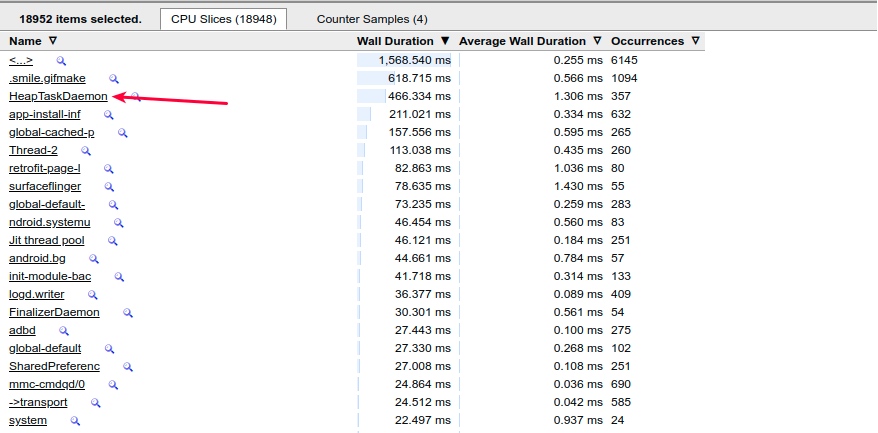
If kswapd0 or HeapTaskDaemon (which handles JVM memory operations) hogs a big core (e.g., CPU 7), the foreground app’s main thread might compete for that core, leading to missed Vsync.
HeapTaskDaemon also typically runs at high frequency during low memory conditions.
 , performing memory-related operations.
Process Death-Restart Cycles
As LMK kills “Cached” processes, their parent processes or other apps often immediately restart them, leading to a “death-restart” cycle. This puts immense strain on CPU, Memory, and I/O.
For example, below is the result after a Monkey test, where QQ is frequently killed and restarted in a short period:
1 | 07-23 14:32:16.932 1435 1510 I am_proc_start: |
The corresponding Systrace - SystemServer shows AM (Activity Manager) frequently killing and restarting QQ: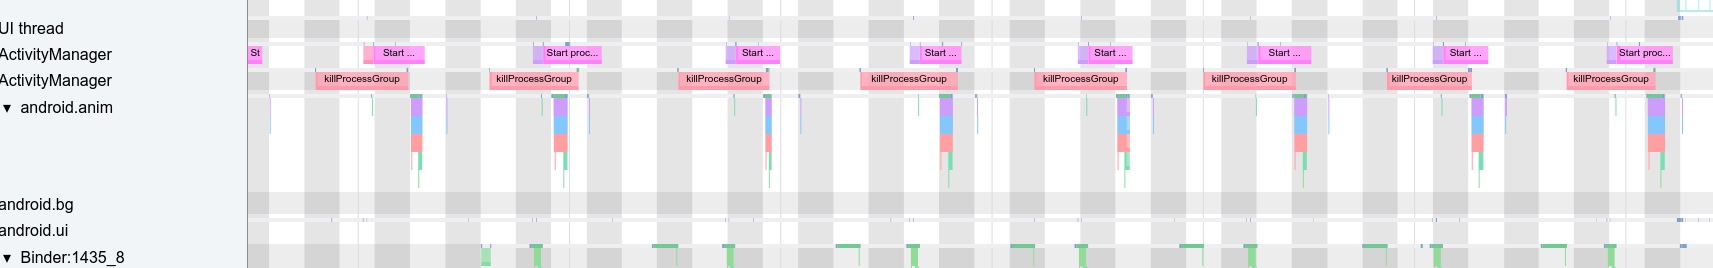
The Kernel section of this trace also shows busy CPU activity:
Memory Reclamation and I/O Triggers
When operations slow down over time, it’s often due to memory reclamation (Fast Path, kswapd, Direct Reclaim, LMK).
- Reclaiming anonymous pages involves swapping them out.
- Reclaiming file-backed pages involves writing back and clearing them.
Both actions, especially those involving files, increase the probability of block I/O.
A common scenario: reopening a recent app feels slow because of a do_page_fault. If the memory was swapped out, it must be swapped in. If it was a regular file, it must be read into the page cache from disk.
do_page_fault → lock_page_or_retry → wait_on_page_bit_killable checks if the page has the PG_locked flag set. If set, it blocks until PG_locked is cleared. The PG_locked flag is cleared only when writeback starts or I/O read completes. The readahead to pagecache functionality also affects block I/O - if too large, it increases blocking probability.
Case Study: App Startup Under Low Memory
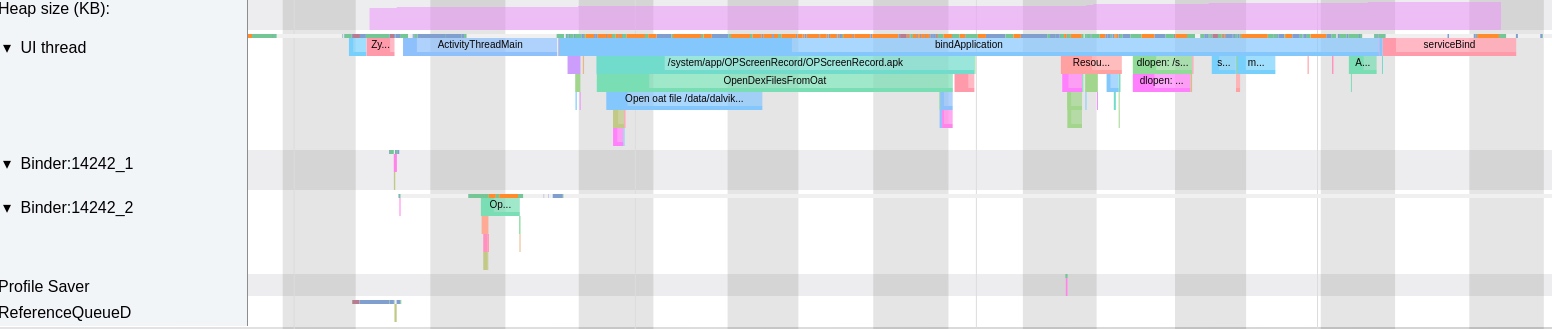
Below is a trace of an app’s cold start under low memory, from bindApplication to the first frame (total 2s).
Low Memory Startup
- Total time: 2s.
Uninterruptible Sleep(I/O block) took ~750ms (vs ~130ms normally).Runningtime was ~600ms (similar to normal).- CPU activity: Many
kworkerandkswapd0threads were active alongside the app.
Normal Memory Startup
- Total time: 1.22s.
Uninterruptible Sleeptotaled only 130ms.- CPU activity: Very few memory/IO-related threads beyond
HeapTaskDaemon.
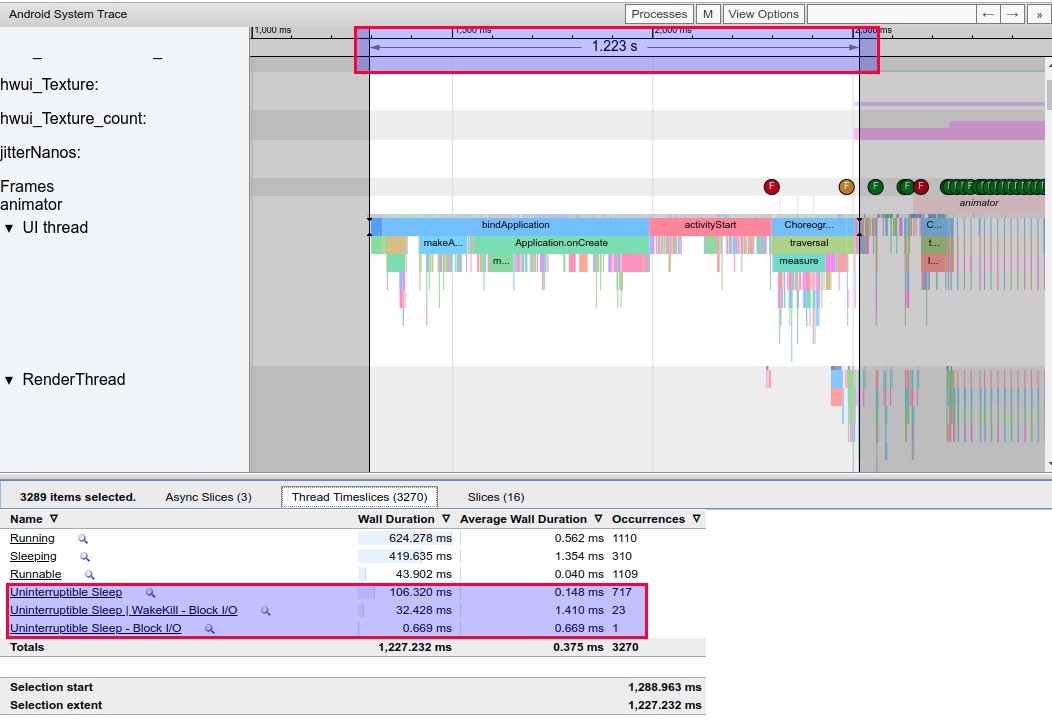
Looking at CPU usage during this period, besides HeapTaskDaemon running more frequently, very few other memory and I/O related processes are active.
Optimization Strategies
Optimizing for low memory requires balancing system control and user experience. Managing third-party apps—many of which use aggressive keep-alive and background services—is crucial.
- Tune
extra_free_kbytes: Increase the threshold for memory reclamation. - Increase Disk I/O Speeds: Use UFS 3.0 or better storage hardware.
- Optimize
read_ahead_kb: Avoid excessively high values that increase block probability. - Cgroup blkio: Use cgroups to limit background I/O, prioritizing foreground responsiveness.
- Proactive Reclamation: Reclaim memory before the user interacts with the app.
- LMK Efficiency: Ensure LMK kills the most effective targets to avoid “death-restart” loops.
- Refine
swappiness: Balance anonymous page swapping vs. file cache clearing. - OEM Policies: Implement more aggressive process management on low-RAM devices.
- User Education: Suggest restarting the phone or clearing background apps when memory is critically low.
- Strategy: Alert users (or not alert users) to kill unnecessary background processes when memory is insufficient
- Strategy: Prompt users to restart the phone when memory is severely insufficient and cannot recover
References
- https://blog.csdn.net/qkhhyga2016/article/details/79540119
- https://blog.csdn.net/zsj100213/article/details/82427527
About Me && Blog
Below are personal introductions and related links. Looking forward to exchanging ideas with fellow professionals - when three people walk together, one must be my teacher!
- Blogger’s Personal Introduction: Contains personal WeChat and WeChat group links.
- Blog Content Navigation: A navigation of personal blog content.
- Personally Organized and Collected Excellent Blog Articles - Android Performance Optimization Must-Knows: Welcome self-recommendations and recommendations (private WeChat chat is fine)
- Android Performance Optimization Knowledge Planet: Welcome to join, thank you for your support!
One person can walk faster, but a group of people can walk farther