This is the second article in the Systrace series, primarily explaining the prerequisites for analyzing Systrace. With these prerequisites, analyzing Systrace will be more effective, allowing you to identify issues faster and more efficiently.
This article introduces how to view thread states in Systrace, how to analyze thread wakeup information, how to interpret data in the information panel, and common shortcuts. By studying this article, you will gain an understanding of process and thread-related information and know how to extract key information from complex Systrace traces.
Table of Contents
- Series Article Index
- Main Content
- Viewing Thread States
- Analyzing Thread Wakeup Information
- Data Parsing in Information Panel
- Using Shortcuts
- Zhihu Article Link
- About Me && Blog
Series Article Index
- Introduction to Systrace
- Systrace Basics - Prerequisites for Systrace
- Systrace Basics - Why 60 fps?
- Android Systrace Basics - SystemServer Explained
- Systrace Basics - SurfaceFlinger Explained
- Systrace Basics - Input Explained
- Systrace Basics - Vsync Explained
- Systrace Basics - Vsync-App: Detailed Explanation of Choreographer-Based Rendering Mechanism
- Systrace Basics - MainThread and RenderThread Explained
- Systrace Basics - Binder and Lock Contention Explained
- Systrace Basics - Triple Buffer Explained
- Systrace Basics - CPU Info Explained
- Systrace Smoothness in Action 1: Understanding Jank Principles
- Systrace Smoothness in Action 2: Case Analysis - MIUI Launcher Scroll Jank Analysis
- Systrace Smoothness in Action 3: FAQs During Jank Analysis
- Systrace Responsiveness in Action 1: Understanding Responsiveness Principles
- Systrace Responsiveness in Action 2: Responsiveness Analysis - Using App Startup as an Example
- Systrace Responsiveness in Action 3: Extended Knowledge on Responsiveness
- Systrace Thread CPU State Analysis Tips - Runnable
- Systrace Thread CPU State Analysis Tips - Running
- Systrace Thread CPU State Analysis Tips - Sleep and Uninterruptible Sleep
Main Content
Viewing Thread States
Systrace uses different colors to identify different thread states. Above each method, there will be a corresponding thread state indicator showing the current status of the thread. By viewing the thread state, we can identify current bottlenecks: whether the CPU execution is slow, if it’s due to a Binder call, IO operations, or waiting for CPU time slices.
Main thread states include:
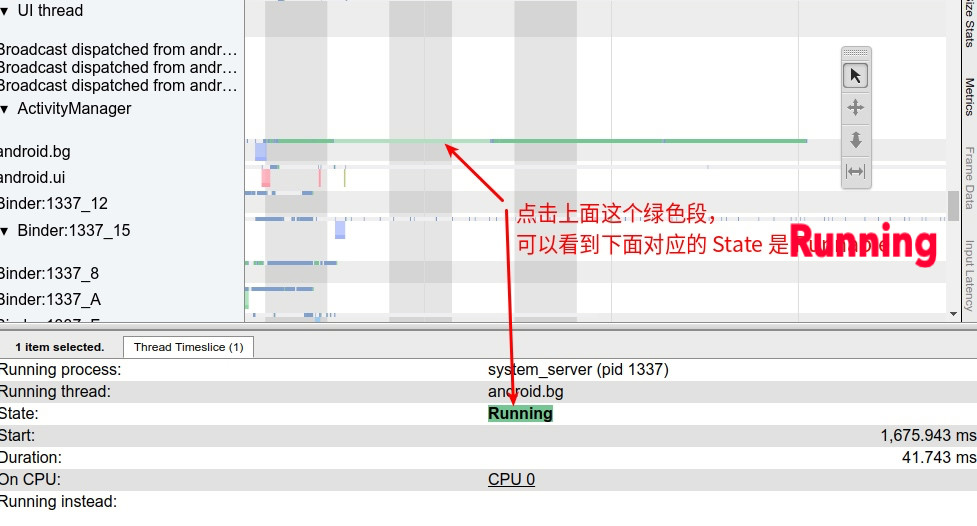
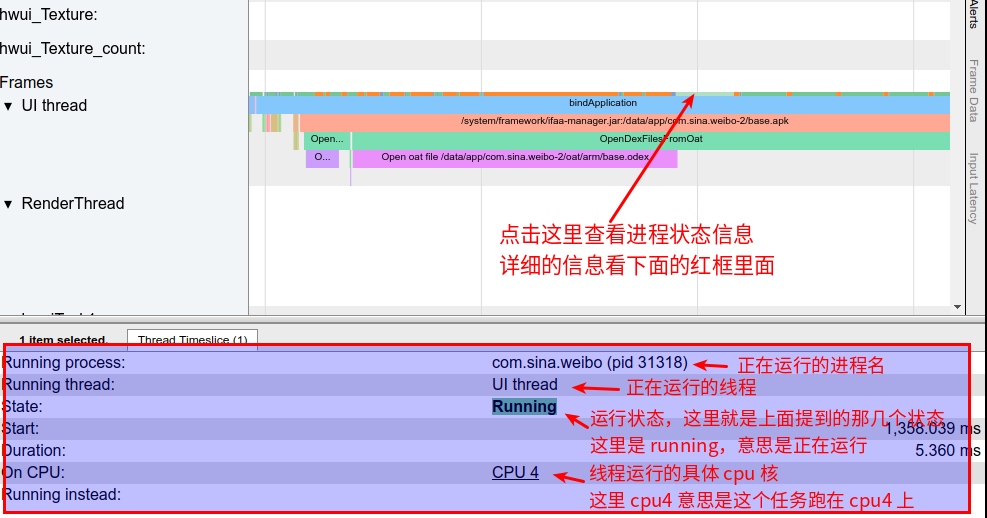
Green: Running
Only threads in this state can run on the CPU. Multiple threads may be in an executable state at the same time, and their task_struct structures are placed in the executable queue of the corresponding CPU (a thread can appear in only one CPU’s executable queue at a time). The scheduler’s task is to select a thread from each CPU’s executable queue to run on that CPU.
Observation Purpose: We frequently check Running threads to compare their execution time with competitors and analyze reasons for speed or slowness:
- Is the frequency insufficient?
- Is it running on a small core?
- Does it switch frequently between Running and Runnable? Why?
- Does it switch frequently between Running and Sleep? Why?
- Is it running on the wrong core? For example, an unimportant thread occupying a super-large core.
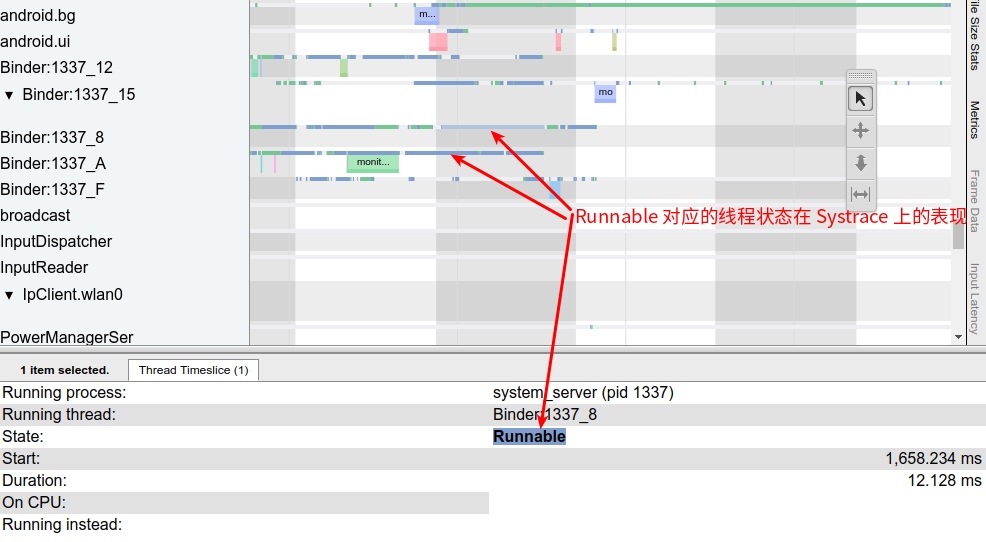
Blue: Runnable
The thread is ready to run but currently not scheduled, waiting for CPU scheduling.
Observation Purpose: The longer a thread stays in the Runnable state, the busier the CPU scheduling is, indicating it hasn’t handled the task promptly:
- Are there too many background tasks running?
- Is the lack of prompt handling due to low frequency?
- Is it restricted to a specific cpuset while the CPU is full?
- What is the currently Running task? Why?
White: Sleep
The thread has no work to do, possibly because it’s blocked on a mutex.
Observation Purpose: Generally waiting for event-driven triggers.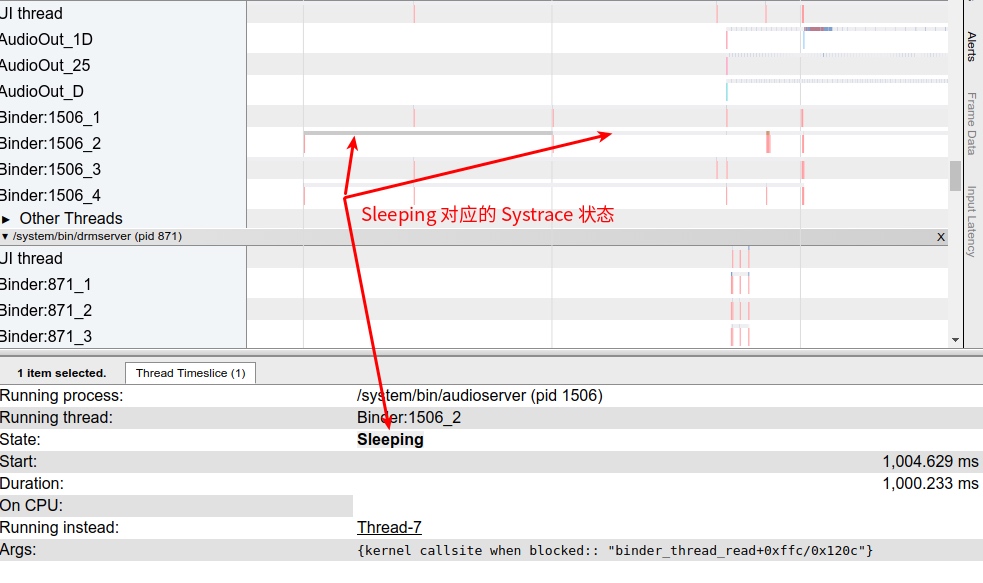
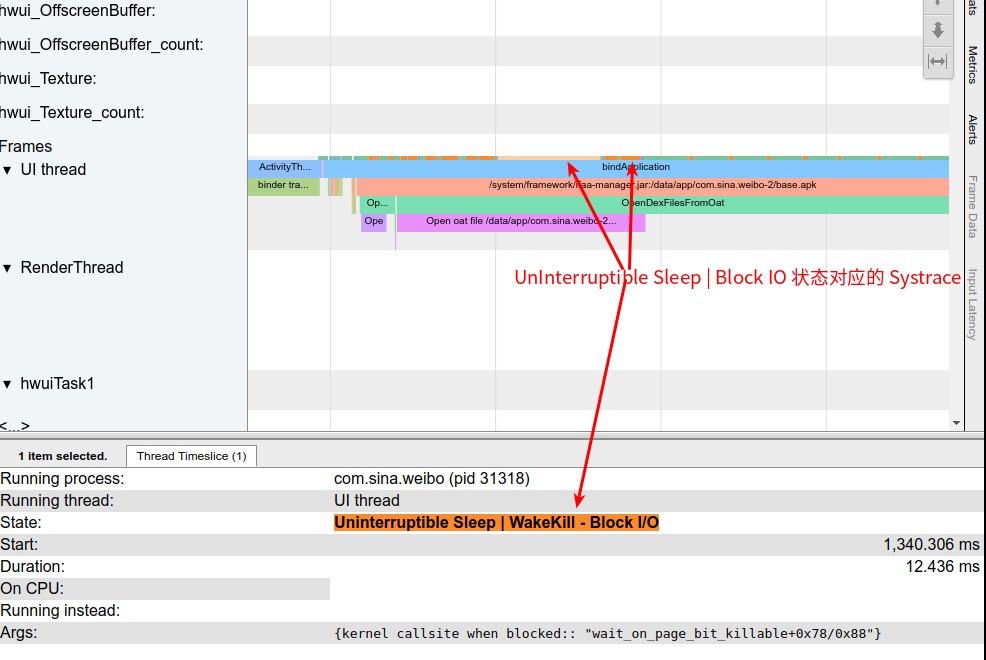
Orange: Uninterruptible Sleep - IO Block
The thread is blocked on I/O or waiting for disk operations to complete. The bottom line usually identifies the callsite: wait_on_page_locked_killable.
Observation Purpose: This generally indicates slow I/O operations. If a large number of orange Uninterruptible Sleep states appear, it’s often due to low memory status, triggering pageFault during memory allocation. In the Linux system’s page cache list, some pages may not be ready yet (i.e., not fully read from disk), leading to wait_on_page_locked_killable blocking when a user accesses that page. This is highly likely to occur with long blocking durations when the system I/O is very busy and operations are queued.
Purple: Uninterruptible Sleep
The thread is blocked on another kernel operation (usually memory management).
Observation Purpose: Generally trapped in kernel mode. This can be normal in some cases and abnormal in others, requiring specific analysis.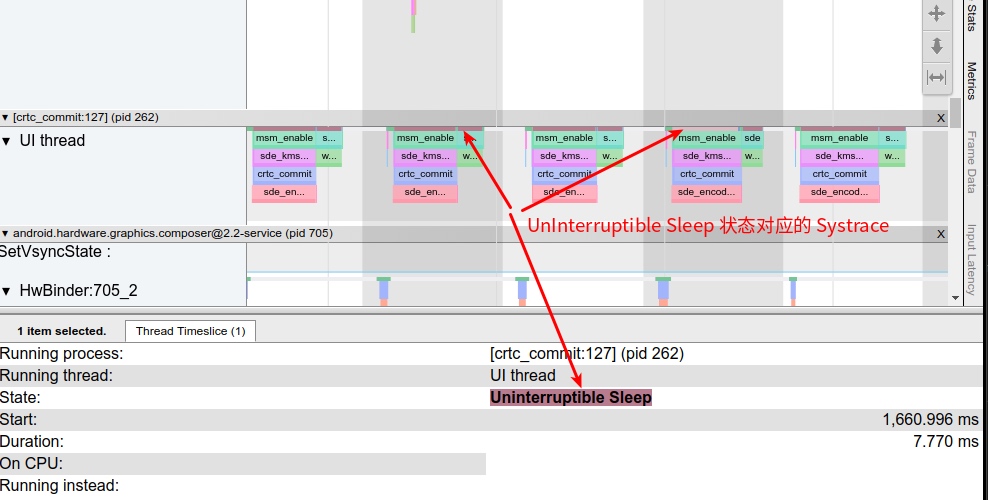
Analyzing Thread Wakeup Information
Systrace identifies a very useful piece of information that helps us analyze thread calls and wait relationships.
Thread wakeup information is crucial. Knowing who waked up a thread tells us the call-wait relationship between them. If a thread sleeps for a long time and then wakes up, we can investigate who woke it up and check the waker’s information to see why they woke it so late.
A common scenario: An application’s main thread uses Binder to communicate with AMS in SystemServer, but the AMS function is waiting for a lock release (or the function itself takes a long time). The app’s main thread then has to wait a long time, leading to performance issues like slow response or jank. This is a primary reason why system performance decreases after running Monkey or when many background processes are active.
Another scenario: The application’s main thread is waiting for results from another thread in the same app. Wakeup information can analyze which thread is blocking the main thread. For example, in the following scenario, a doFrame took 152ms—a clear abnormality—but most of the time was spent in sleep.
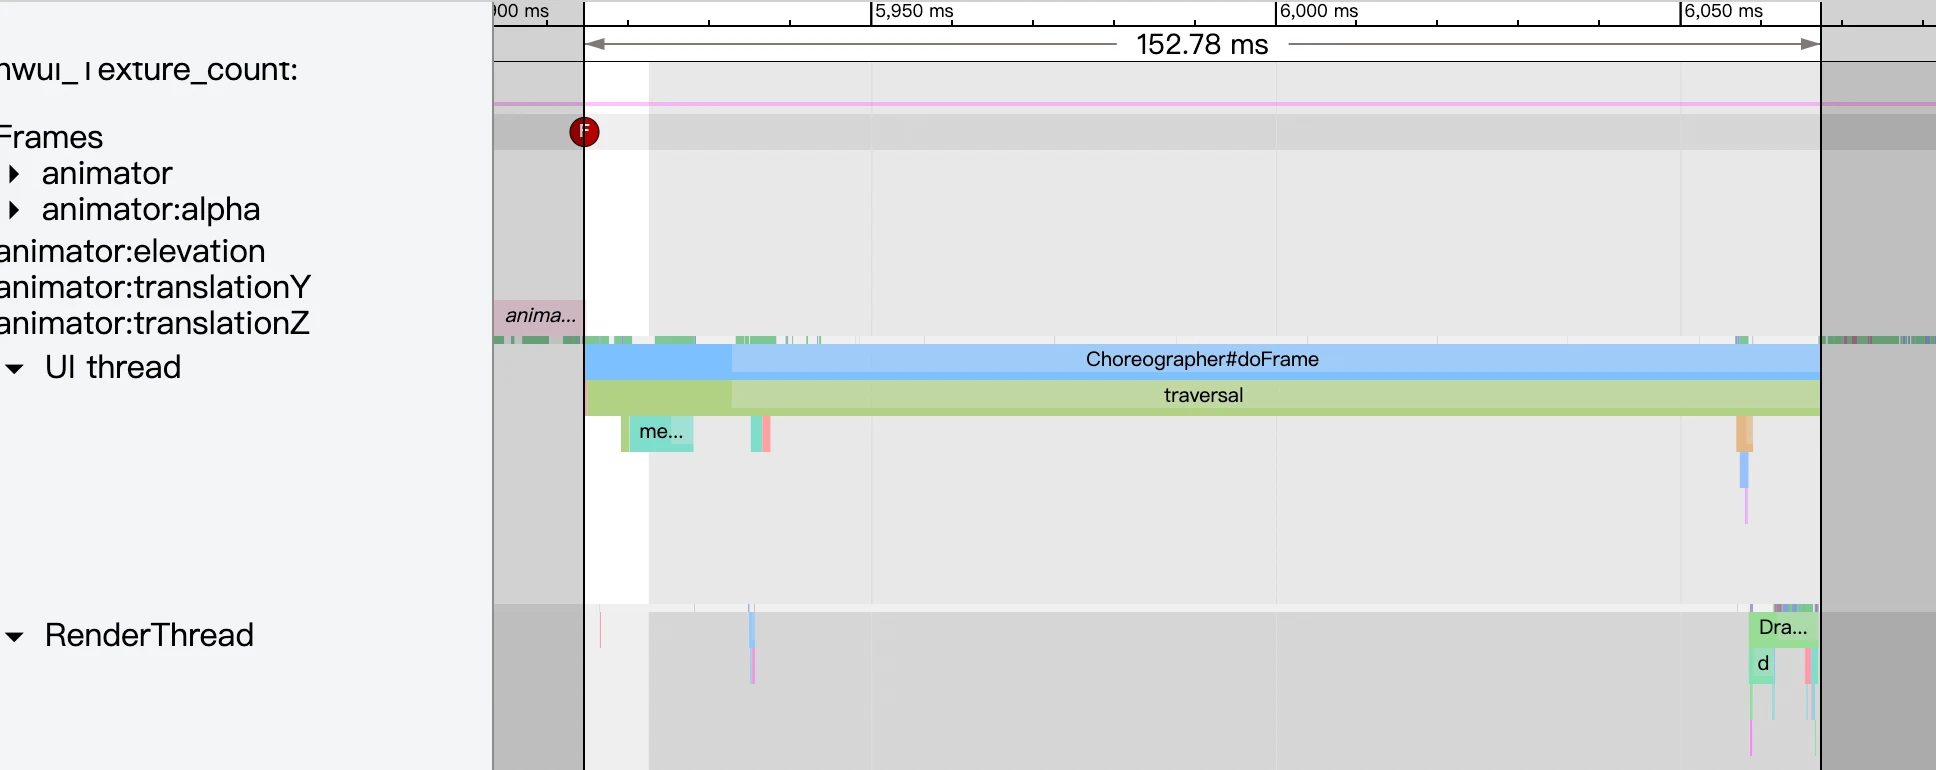
Zooming in reveals segmental wakeups. Clicking on the runnable section displays wakeup information in the panel below, allowing you to trace what the thread was doing.
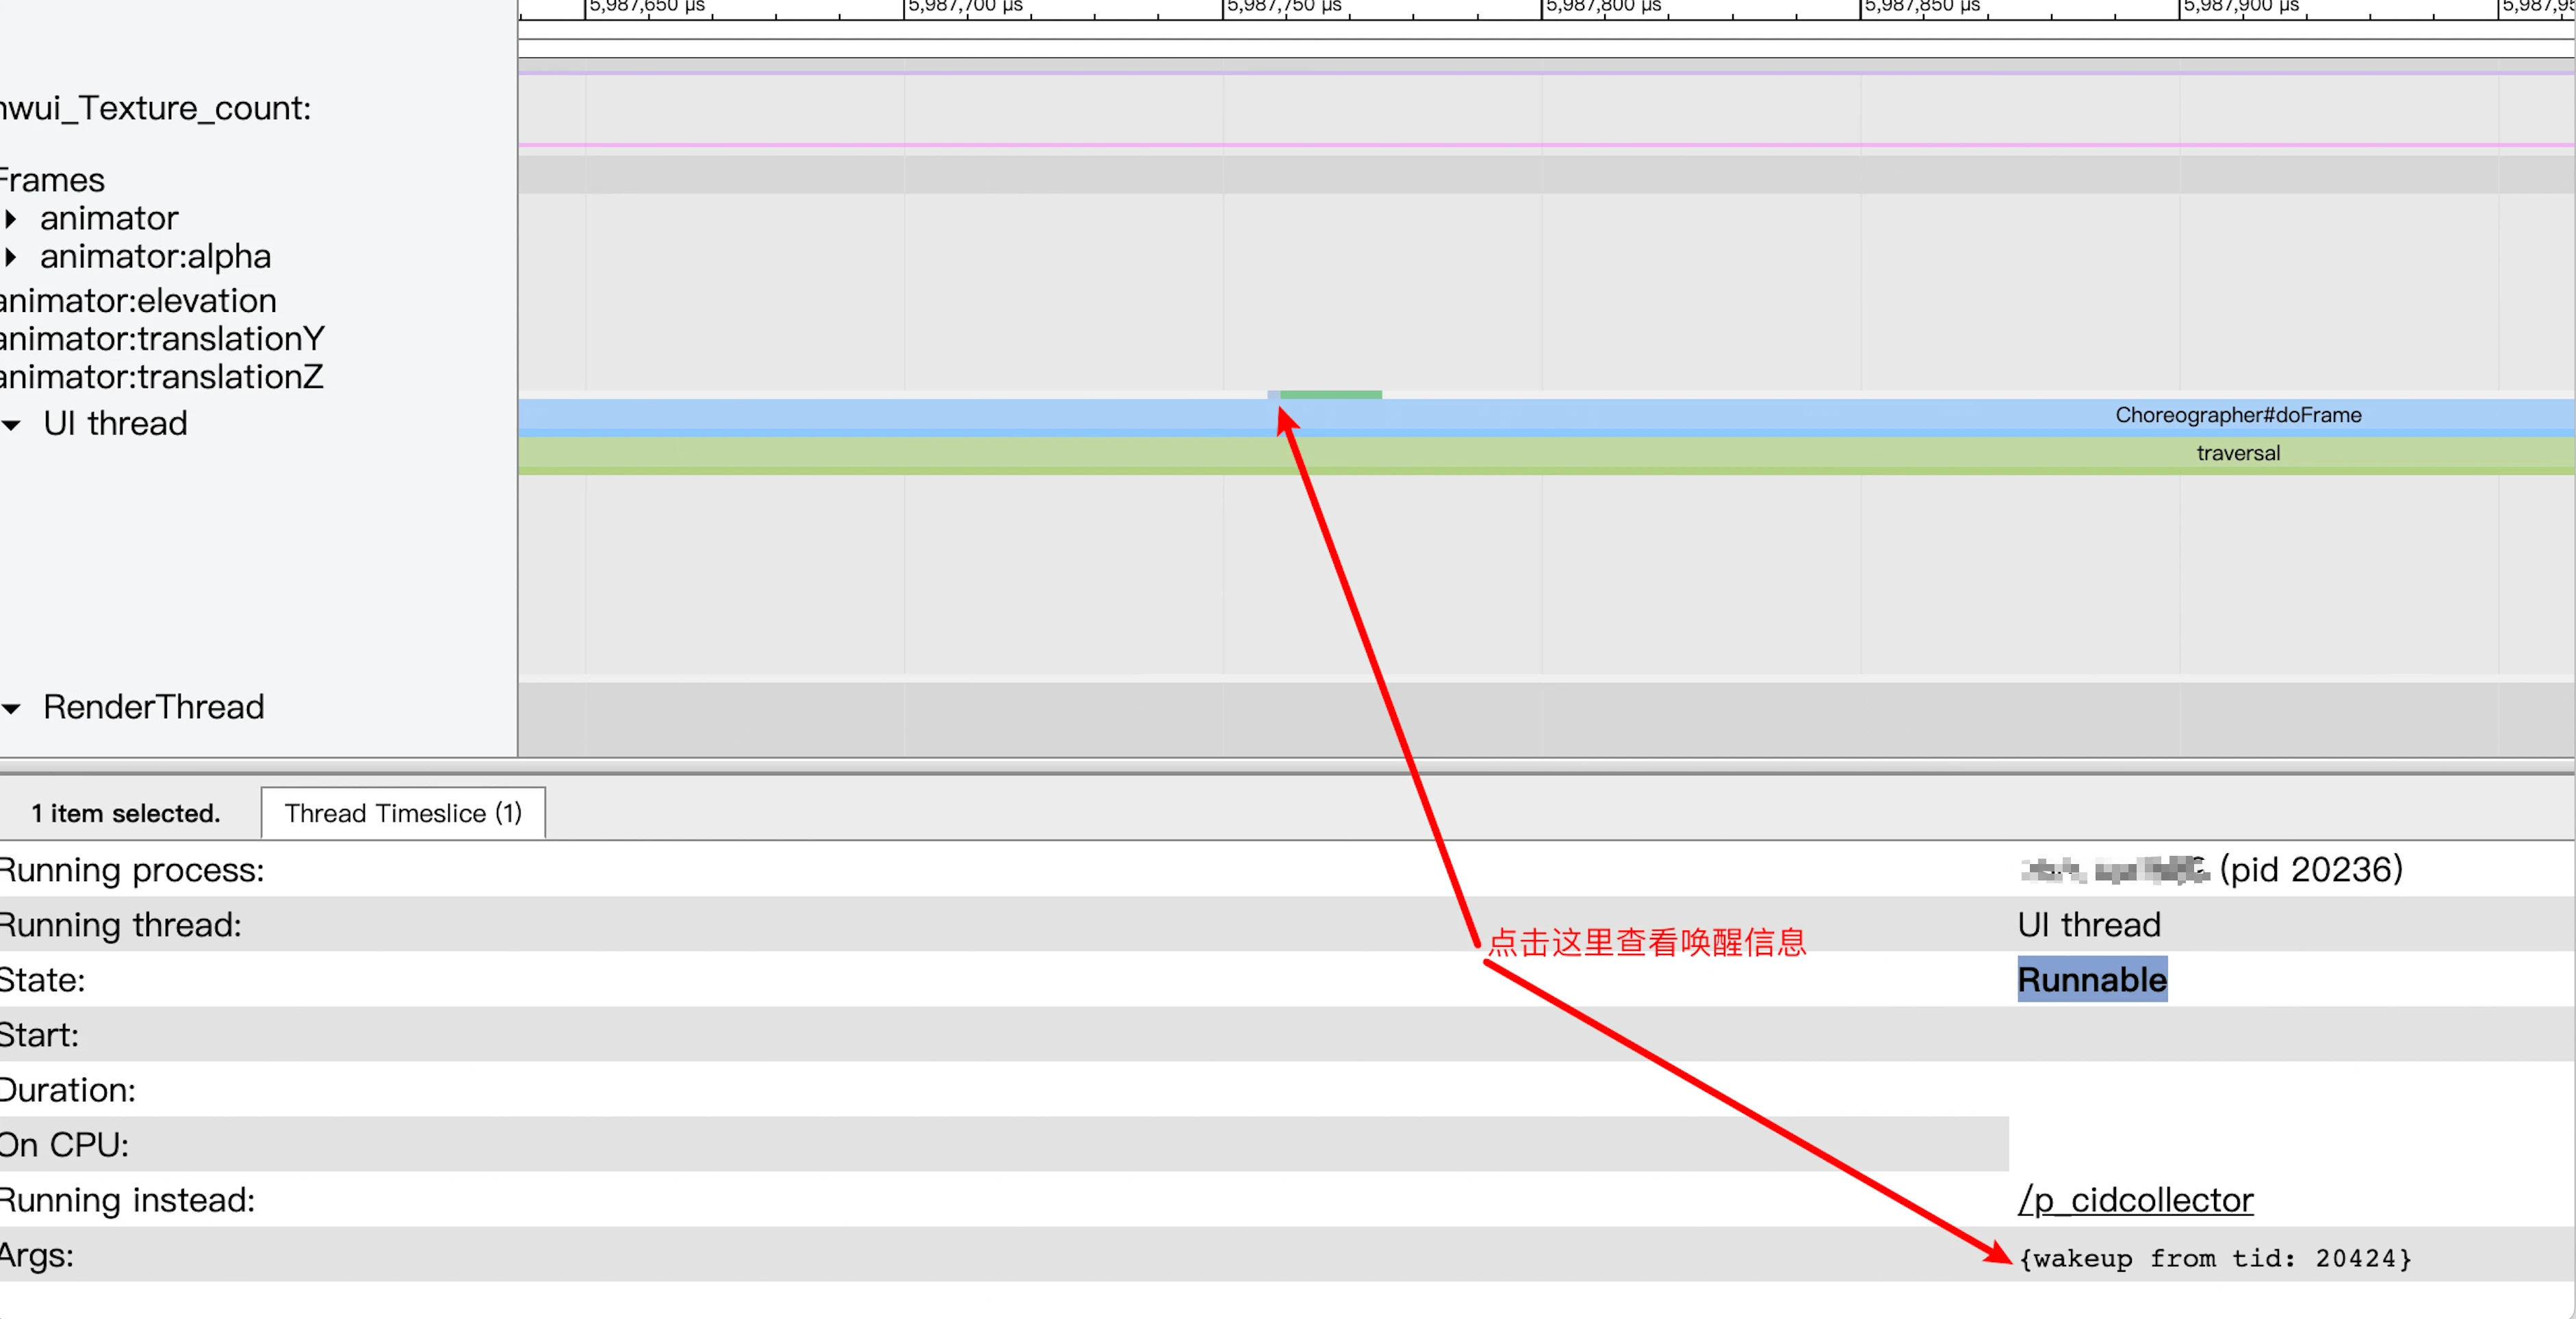
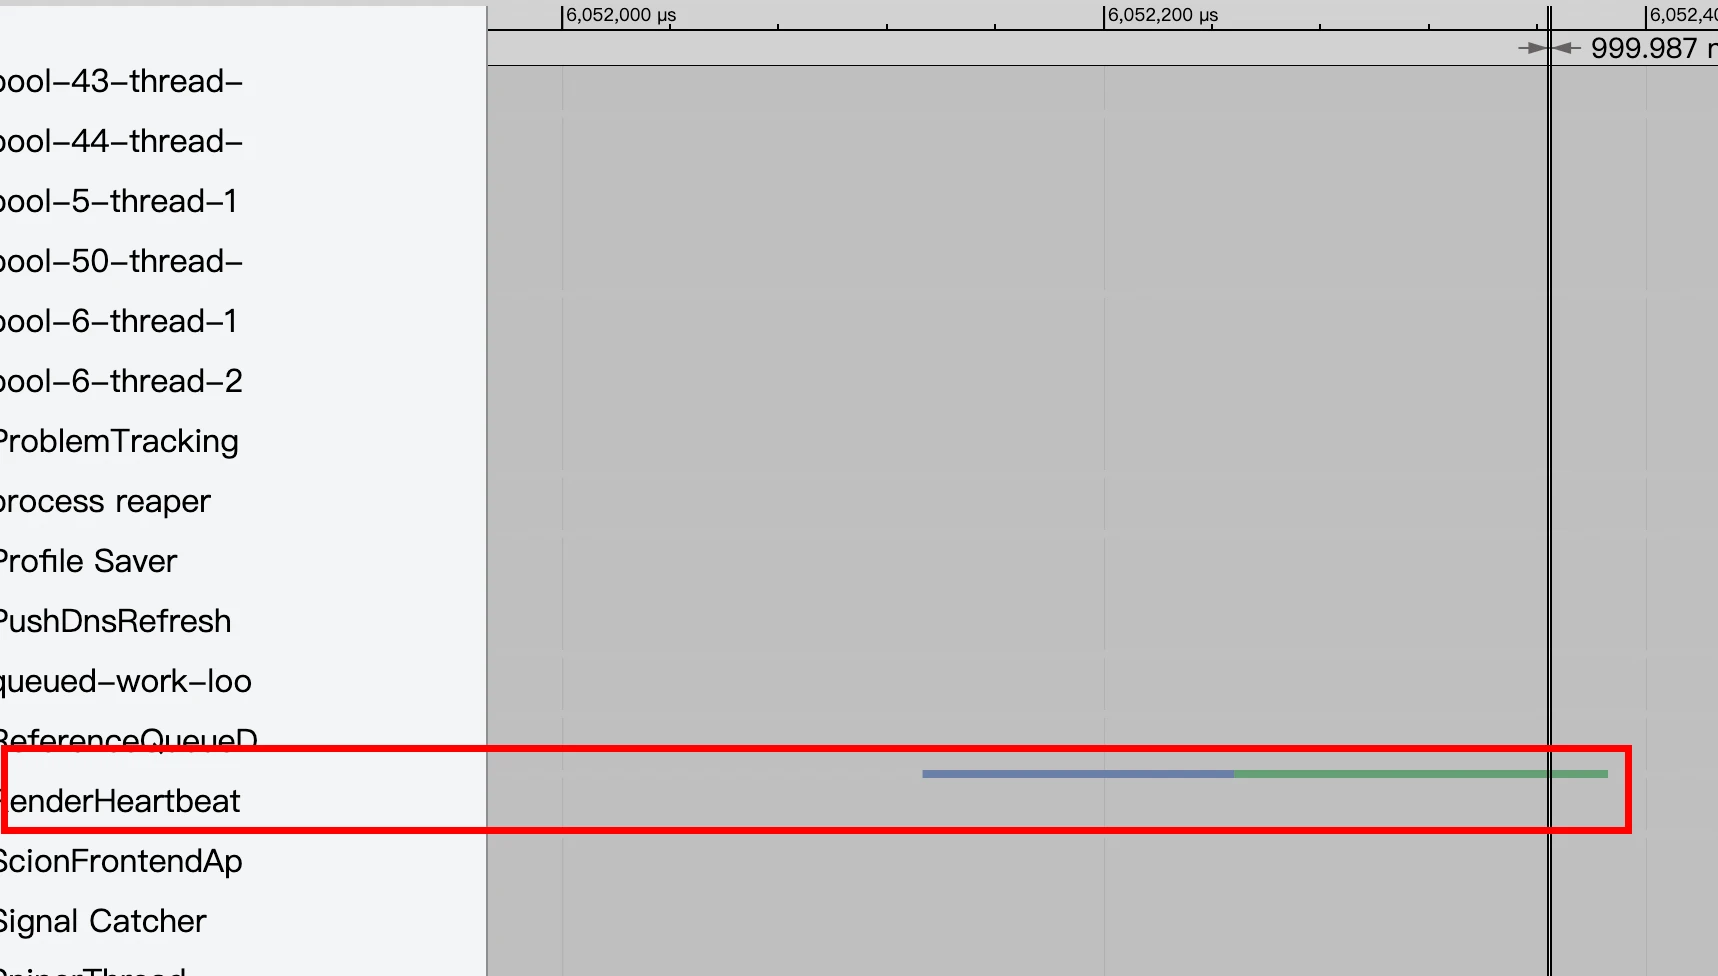
The thread 20424 is RenderHeartbeat, which involves the App’s own code logic. The App needs to analyze what RenderHeartbeat was doing.
Systrace can label this because a task enters the Runnable state before entering Running, and Systrace marks this state (very short, needs zooming to see).
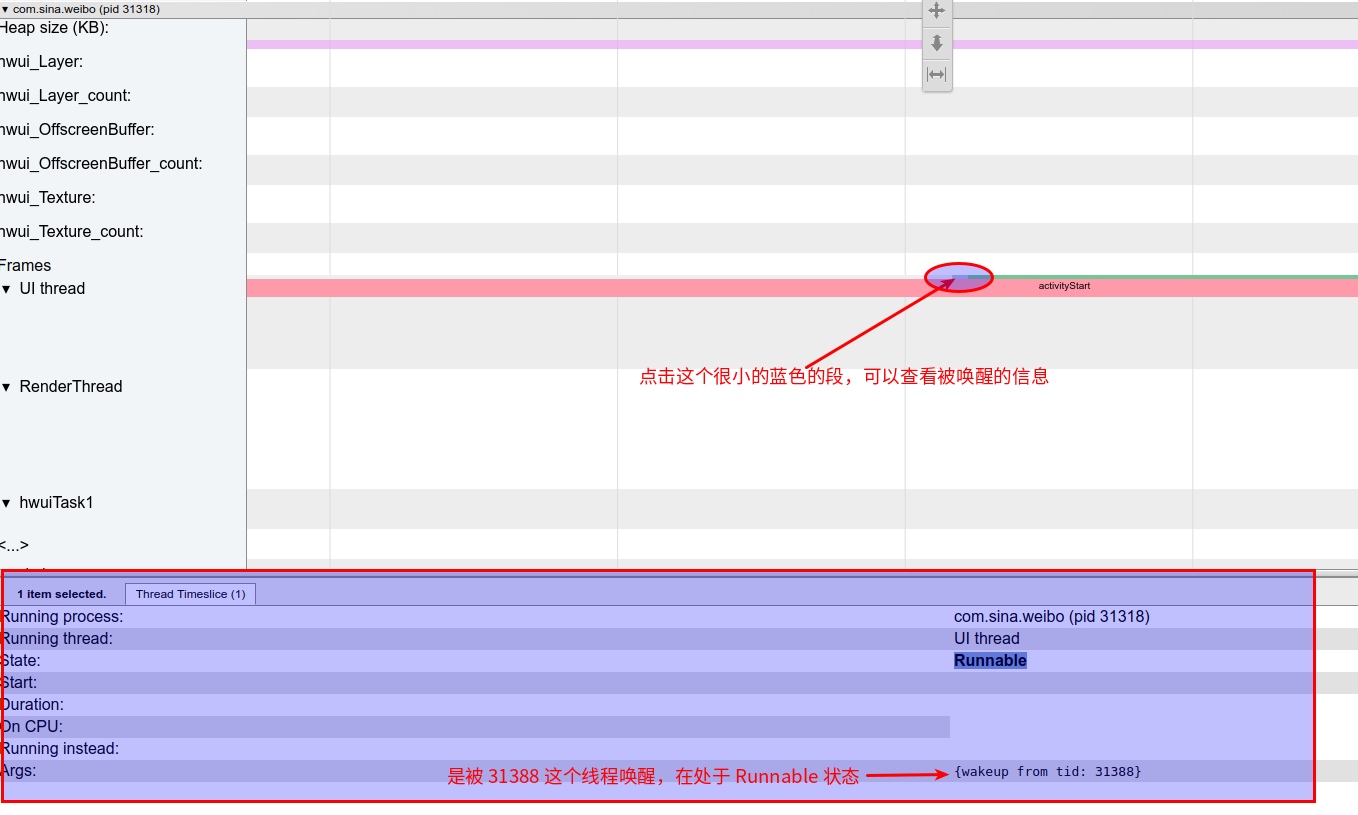
Scrolling to the top to check task info on the corresponding CPU identifies the task’s state before being waked up: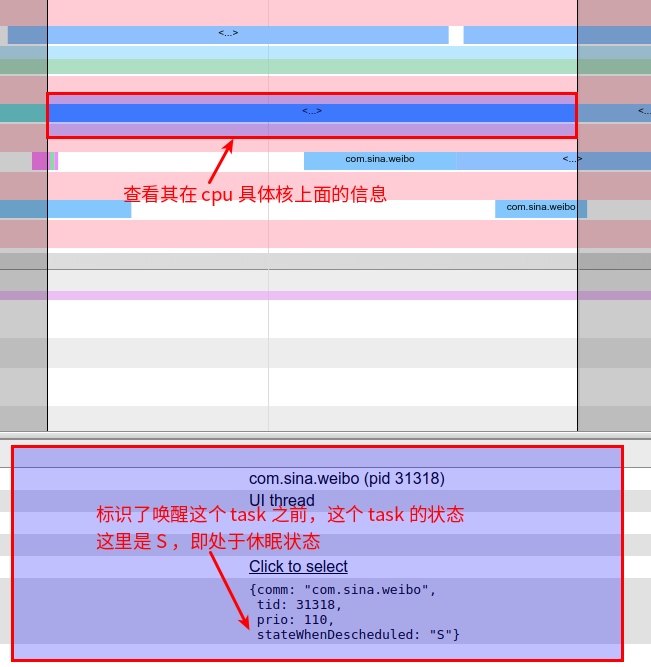
Common Linux process states:
- D: Uninterruptible sleep (usually IO processes).
- R: In the runnable queue waiting for scheduling.
- S: Sleeping.
- T: Stopped or traced.
- W: Paging (invalid since kernel 2.6).
- X: Dead process (very rare).
- Z: Zombie process.
- <: High-priority process.
- N: Low-priority process.
- L: Pages locked into memory.
- s: Session leader (has child processes).
- l: Multi-threaded (using CLONE_THREAD, like NPTL pthreads).
- +: Process group in foreground.
Data Parsing in Information Panel
Thread State Interpretation
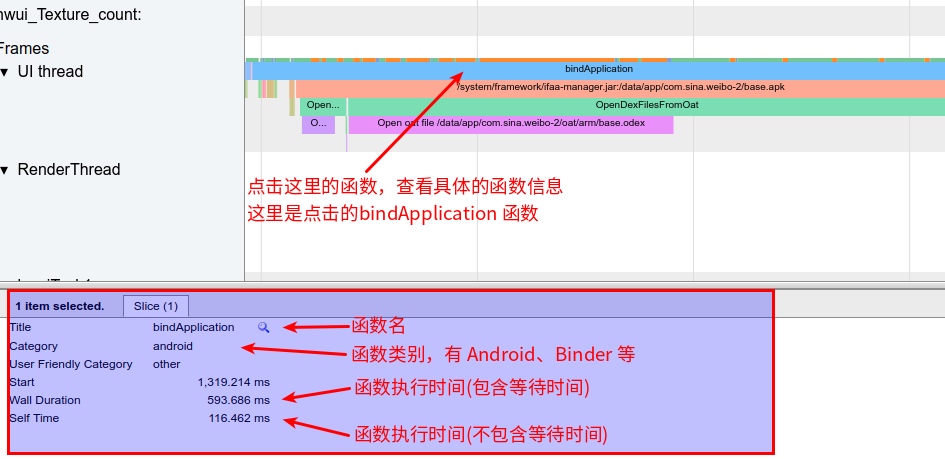
Function Slice Interpretation
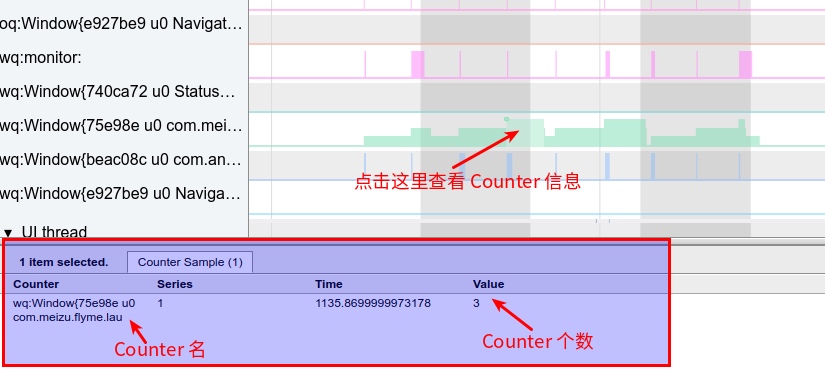
Counter Sample Interpretation
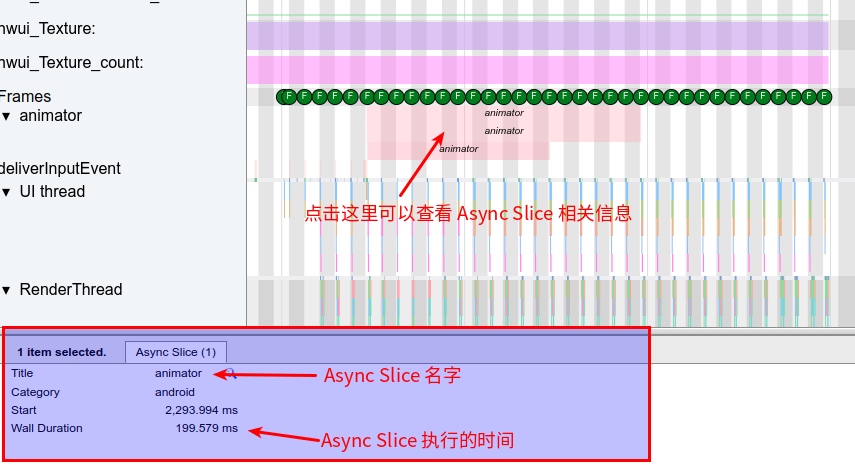
Async Slice Interpretation
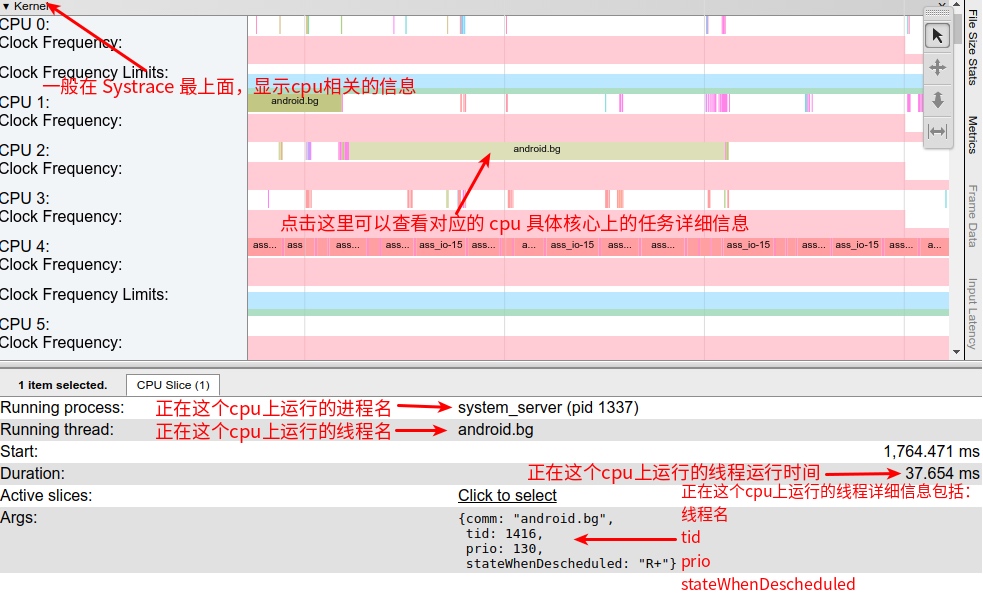
CPU Slice Interpretation
User Expectation Interpretation
Located at the very top of Systrace, identifying Rendering Response and Input Response.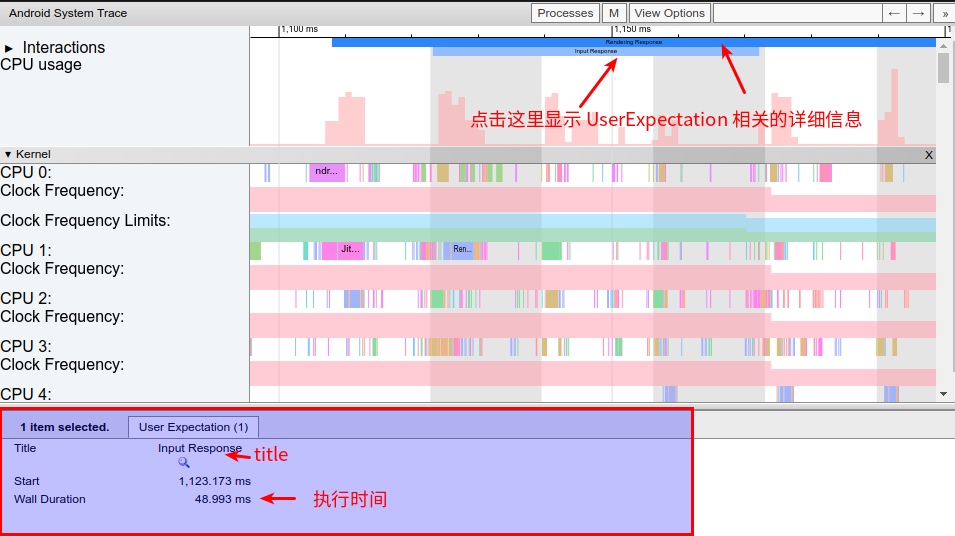
Using Shortcuts
Shortcuts can speed up Systrace viewing. Here are common ones:
W: Zoom in for local details.
S: Zoom out for the overview.
A: Move left.
D: Move right.
M: Highlight the currently clicked segment (very useful for identifying boundaries and duration).
Mouse mode switching: Switch experimental modes for the mouse. Default is 1 (Selection mode). Direct shortcut switching is much more efficient than clicking.
Number 1: Switch to Selection mode. Click segments for details. Most commonly used.
Number 2: Switch to Pan mode. Long-press to drag left/right.
Number 3: Switch to Zoom mode. Long-press to zoom.
Number 4: Switch to Timing mode. Measure time between a selected start and end point.
Zhihu Article Link
Since blog comments are less convenient, feel free to visit the Zhihu or Juejin pages for this article to like or exchange ideas:
Zhihu - Android Systrace Basics - Prerequisites for Analyzing Systrace
Juejin - Android Systrace Basics - Prerequisites for Analyzing Systrace
About Me && Blog
Below is my personal intro and related links. I look forward to exchanging ideas with fellow professionals. “When three walk together, one can always be my teacher!”
- Blogger Intro: Includes personal WeChat and WeChat group links.
- Blog Content Navigation: A guide for my blog content.
- Curated Excellent Blog Articles - Android Performance Optimization Must-Knows: Welcome to recommend projects/articles.
- Android Performance Optimization Knowledge Planet: Welcome to join and thank you for your support~
One walks faster alone, but a group walks further together.