Series Catalog:
- Overview of Android Performance Patterns
- Android Performance Patterns: Render Performance
- Android Performance Patterns: Understanding Overdraw
- Android Performance Patterns: Understanding VSYNC
- Android Performance Patterns: Profile GPU Rendering
“If you can measure it, you can optimize it” is a common term in the computing world, and for Android’s rendering system, the same thing holds true. In order to optimize your pipeline to be more efficient for rendering, you need a tool to give you feedback on where the current perf problems lie.
In this video, Colt McAnlis walks you through an on-device tool built for this exact reason. “Profile GPU Rendering” will help you understand the stages of the rendering pipeline, see which portions might be taking too long, and decide what to do about it in your application.
Profile GPU Rendering Tool
Rendering performance issues are often the culprits stealing your precious frames. These problems are easy to create but also easy to track with the right tools. Using the Profile GPU Rendering tool, you can see right on your device exactly what is causing your application to stutter or slow down.
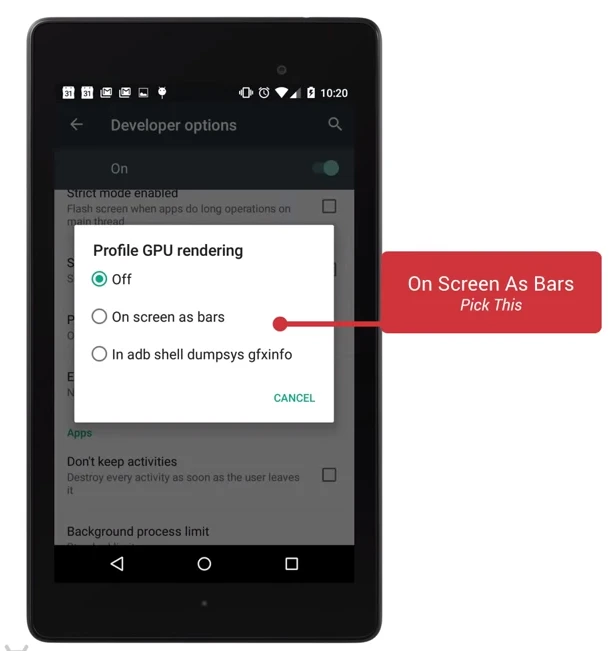
This tool is located in Settings -> Developer Options -> Profile GPU rendering. Once enabled, select “On screen as bars”:
A series of small bar graphs made of three colors will appear on the screen, along with a green line:
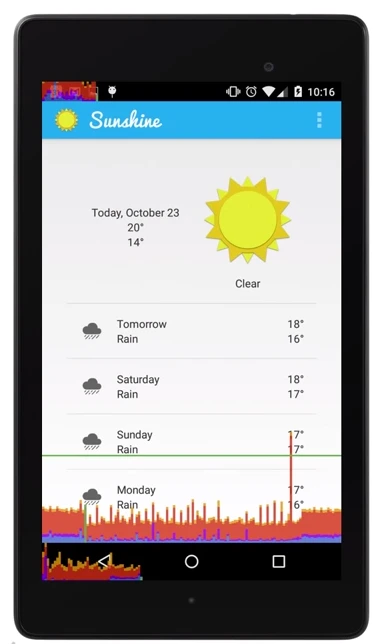
The tool displays analyzed graphical data on the screen. The bottom shows navigation info, the top shows notification info, and the middle shows information for the current application.
Using the GPU Profile Tool
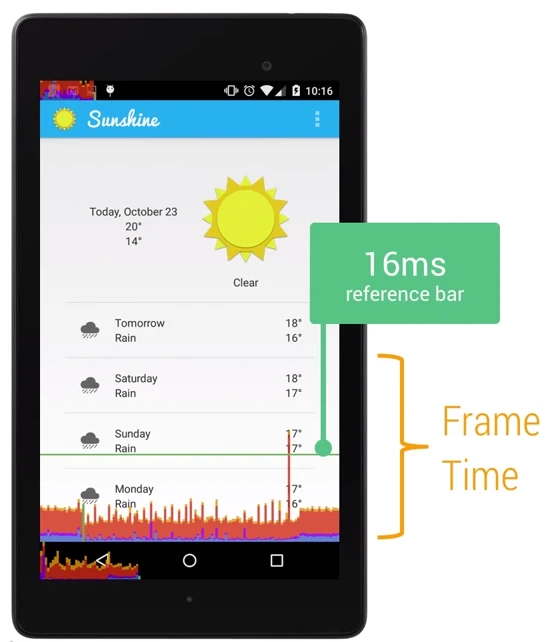
As your application runs, you’ll see a row of bar graphs moving dynamically from left to right. Each vertical bar represents the rendering of one frame; a longer bar means that frame took longer to render. As frames accumulate, they stack up, allowing you to observe frame rate changes over time.
The Green Line
The green line represents the 16ms threshold. To achieve a smooth 60fps, every bar must stay below this green line. Any time a vertical bar crosses the green line, you’ll likely notice a stutter in your animation.
The Bar Colors
Each bar consists of three colors: Blue, Red, and Orange (Yellow). These colors correspond directly to stages in the Android rendering pipeline:
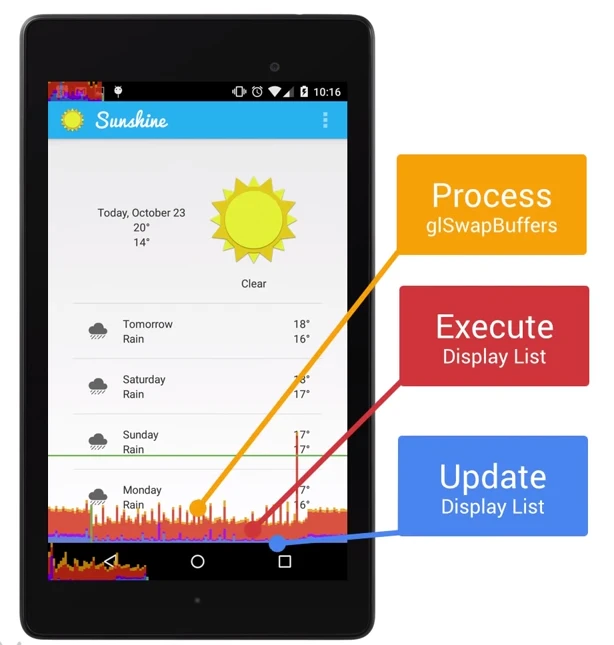
Blue represents Measure/Draw time—the time spent creating and updating your DisplayLists. Before a view can be rendered, it must be converted into a format the GPU understands (drawing commands). This includes handling custom views and paths. Once done, the result is cached as a DisplayList object. Blue time tracks how long it takes to update these lists (i.e., executing
onDrawfor each view).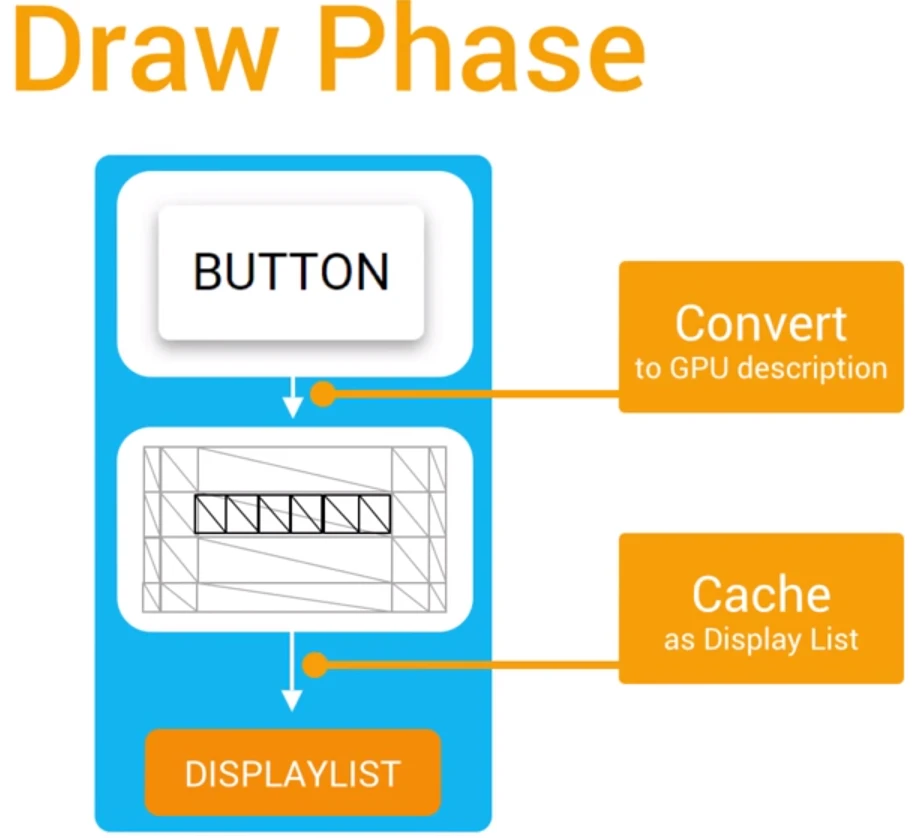
If you see tall blue bars, it might be because many views were invalidated at once (requiring redrawing) or because specific
onDrawfunctions are too complex.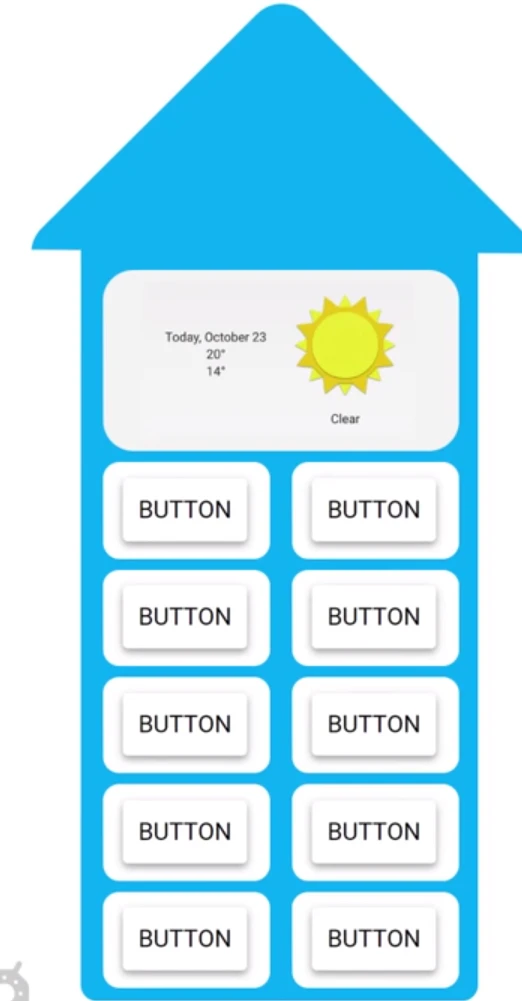
Red represents Execute time—the time Android takes to process 2D DisplayLists. To draw on the screen, Android uses OpenGL ES APIs to send DisplayList data to the GPU.
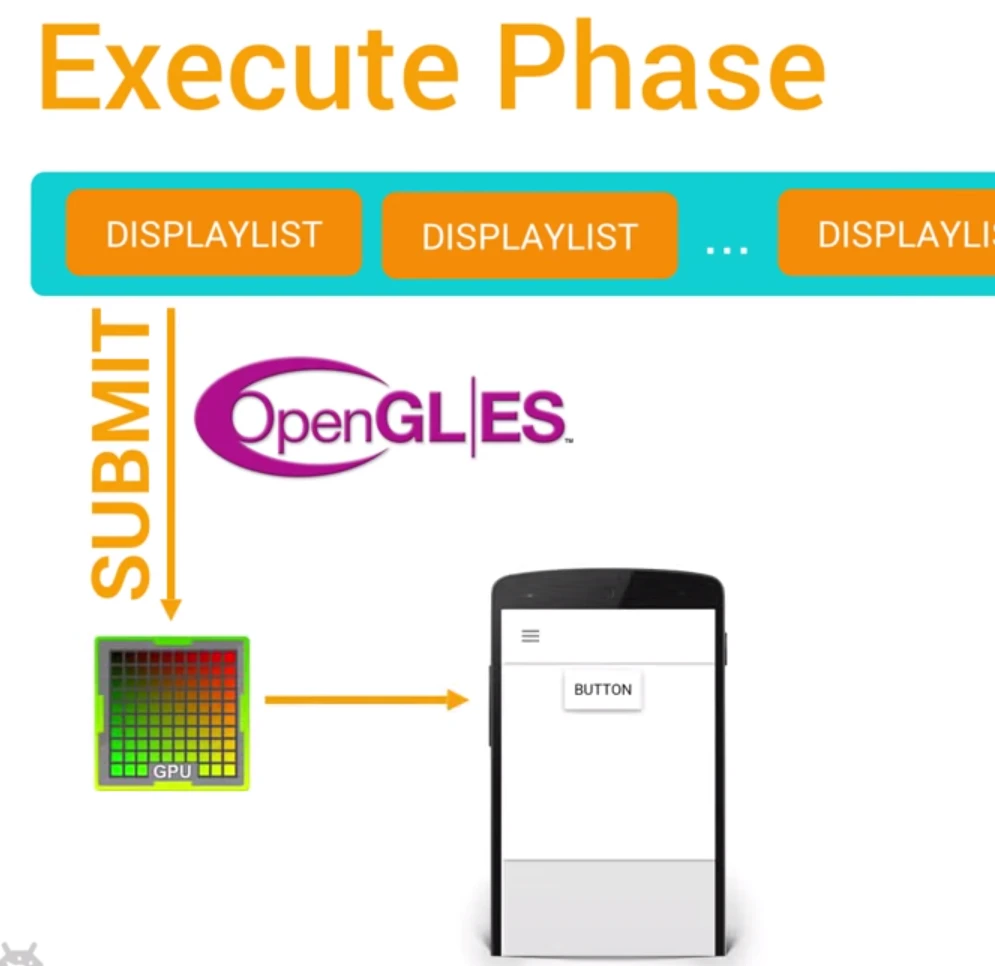
Note that complex custom views (like the one below) require more complex OpenGL commands.
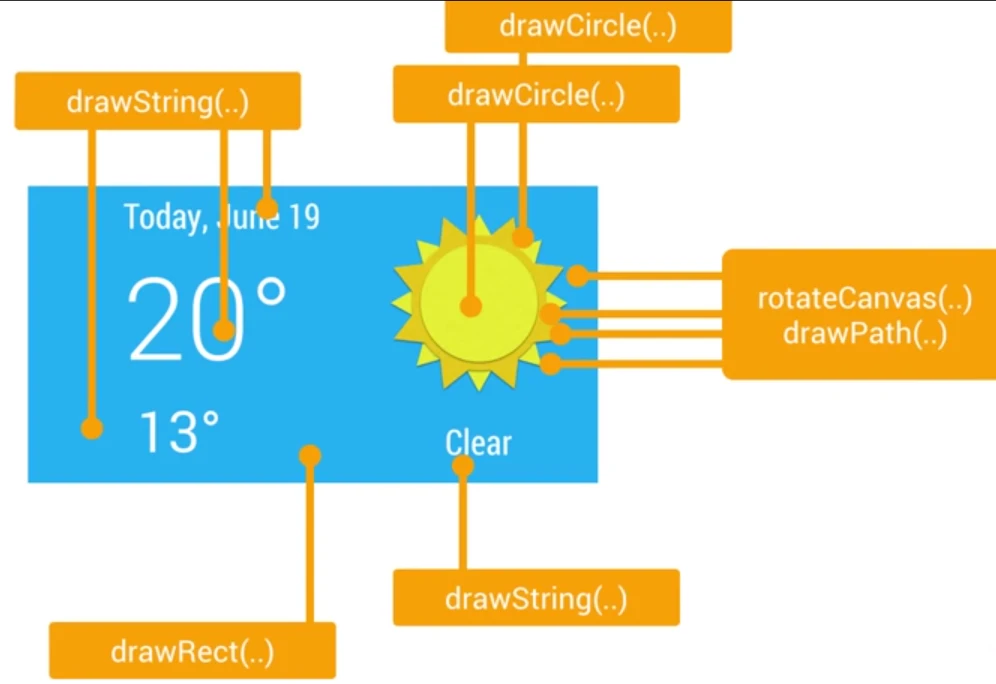
Tall red bars are often caused by these complex custom views:
Another possibility for tall red bars is re-submitting views. Even if views aren’t technically invalid, certain events (like rotation) require clearing and redrawing areas, which impacts the views below them.
Orange/Yellow represents Process time—the time the CPU spends telling the GPU to render a frame. This is a blocking call because the CPU waits for the GPU to acknowledge the command. If this is high, it means you’re giving the GPU too much work (too many complex OpenGL commands to handle).
The key to smooth animations is keeping these bars below the green line.
Summary
The GPU Profile tool is great for finding rendering issues, but fixing them requires deeper code analysis to find and optimize specific bottlenecks. Sometimes, you can use these metrics to convince designers to adjust their requirements for a better user experience.
Perf Matters
Keep calm, profile your code, and always remember, Perf Matters.
About Me && Blog
Below is my personal intro and related links. I look forward to exchanging ideas with fellow professionals. “When three walk together, one can always be my teacher!”
- Blogger Intro
- Blog Content Navigation: A guide for my blog content.
- Curated Excellent Blog Articles - Android Performance Optimization Must-Knows
- Android Performance Optimization Knowledge Planet
One walks faster alone, but a group walks further together.