Series Catalog:
- Overview of Android Performance Patterns
- Android Performance Patterns: Render Performance
- Android Performance Patterns: Understanding Overdraw
- Android Performance Patterns: Understanding VSYNC
- Android Performance Patterns: Profile GPU Rendering
Rendering performance is all about how fast you can draw your activity, and get it updated on the screen. Success here means your users feeling like your application is smooth and responsive, which means that you’ve got to get all your logic completed, and all your rendering done in 16ms or less, each and every frame. But that might be a bit more difficult than you think.
In this video, Colt McAnlis takes a look at what “rendering performance” means to developers, alongside some of the most common pitfalls that are ran into; and let’s not forget the important stuff: the tools that help you track down, and fix these issues before they become large problems.
Android Rendering Knowledge
When you think you’ve developed a world-changing app, your users might not agree. They might think your app is slow and laggy, failing to achieve the smoothness they expect, let alone changing the world. Recycle bin, here it comes! Wait! My app is perfectly smooth on my Nexus 5? How can you say it’s slow? If you know anything about Android fragmentation, you’d know that many low-end phones don’t have the powerful processor and GPU of a Nexus 5, nor do they have an unpolluted stock system.
If a large number of users complain that your app is laggy, don’t just blame their hardware. Sometimes the problem lies within the app itself, meaning your Android app has serious rendering performance issues. Only by understanding the root cause can you solve the problem effectively. Thus, knowing how Android rendering works is essential for any Android developer.
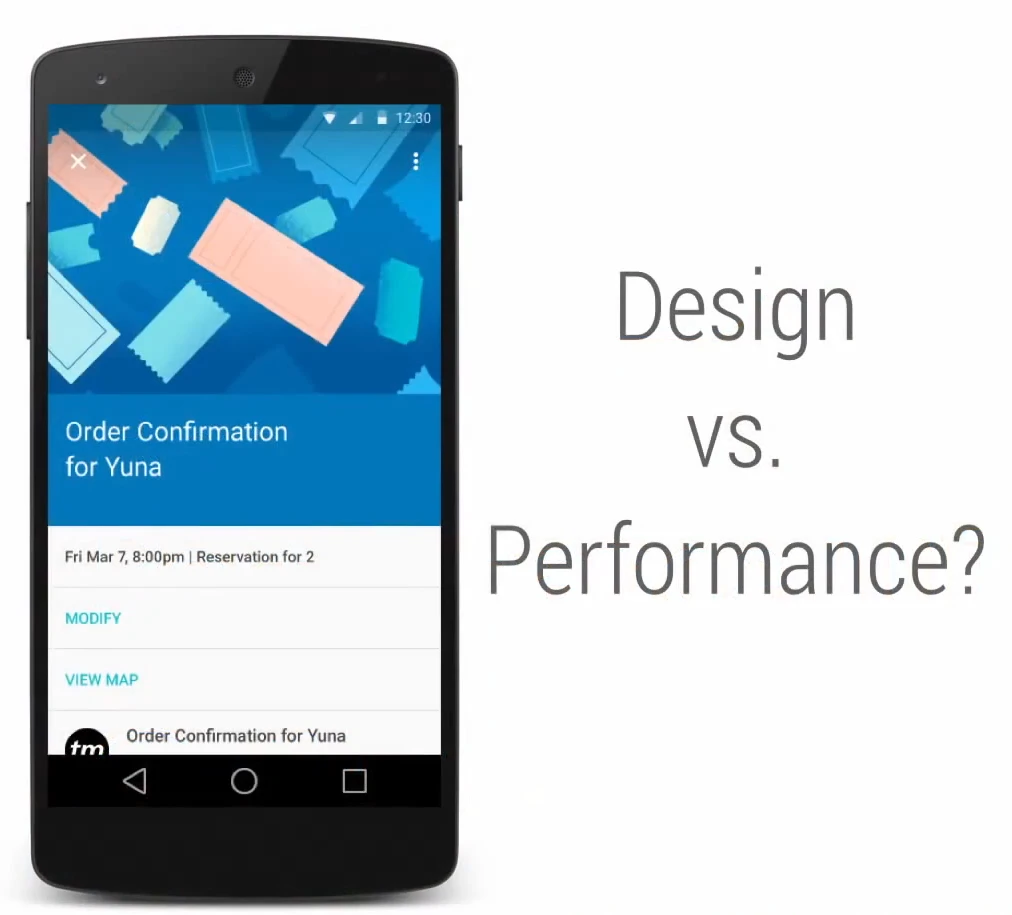
Design vs Performance
Rendering issues are the most common problems you’ll encounter when building an app. On one hand, designers want to provide a supernatural experience; on the other hand, these flashy animations and views may not run smoothly on all Android phones. That’s where the problem lies.
Drawing Principles
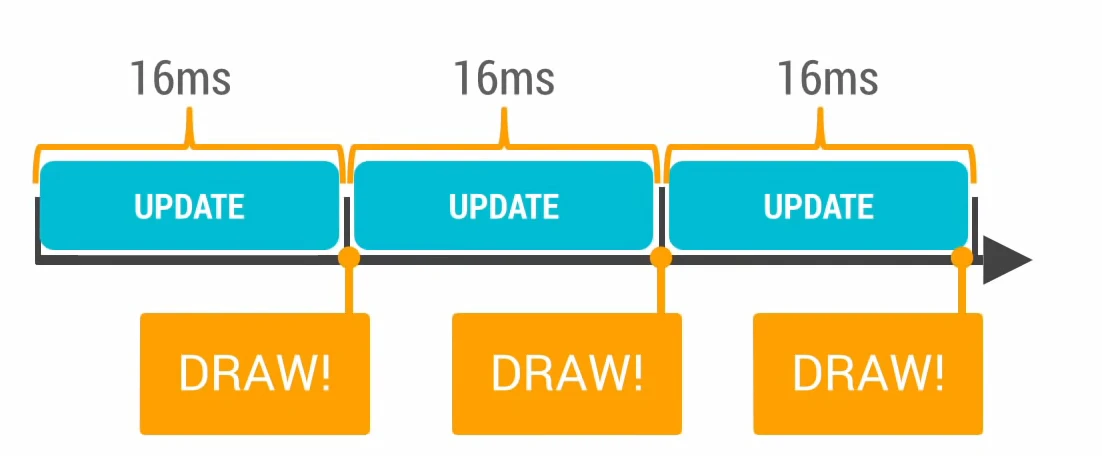
The Android system redraws your Activity every 16ms. This means your logic and screen updates must complete within 16ms to achieve 60 frames per second (we’ll have a dedicated topic on why it’s 60fps later). As shown below, when every frame completes within 16ms, the world is smooth.
However, if your app fails to complete a frame within 16ms—say it takes 24ms—you’ll experience what we call a Dropped Frame (Jank). The world becomes laggy.
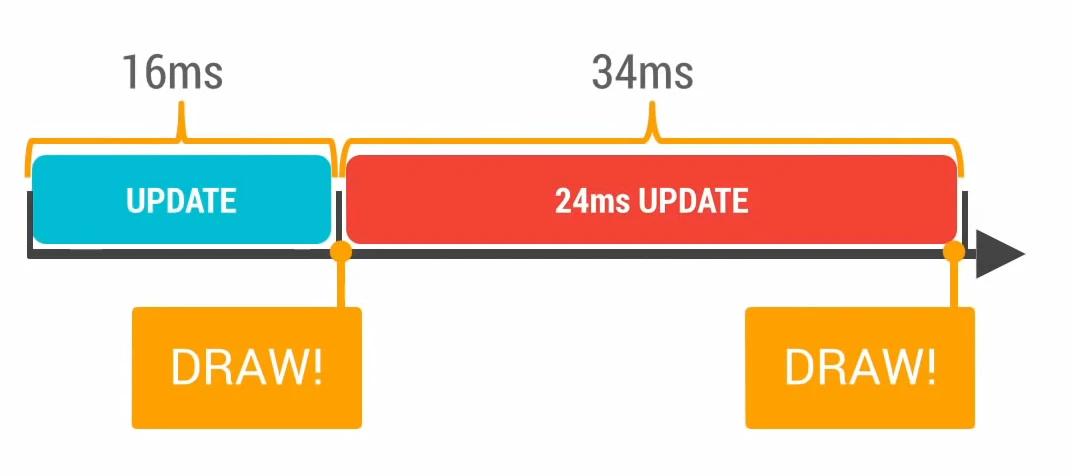
The system is ready to draw a new frame to the screen, but because the frame isn’t ready, no drawing operation occurs, and the screen doesn’t refresh. To the user, it feels like they’re staring at the same image for 32ms instead of 16ms. That’s a frame drop.
Frame Drops
Frame drops are a core user experience issue. Users easily perceive the stuttering caused by dropped frames, especially during interactions like list scrolling or typing. Users will immediately complain, and the next step is often uninstalling your app. Understanding the causes of frame drops is critical.
Unfortunately, many things can cause frame drops, such as:
- Spending too much time redrawing most things in your view, wasting CPU cycles.
- Having too many objects stacked together, spending too much time drawing objects the user can’t see.
- Having a bunch of animations repeating over and over, leading to massive CPU and GPU waste.
Detection and Solution
Detecting and solving these issues depends heavily on your application architecture. Fortunately, we have many developer tools to help. Some tools can even trace down to specific lines of code or UI controls. These tools include but are not limited to:
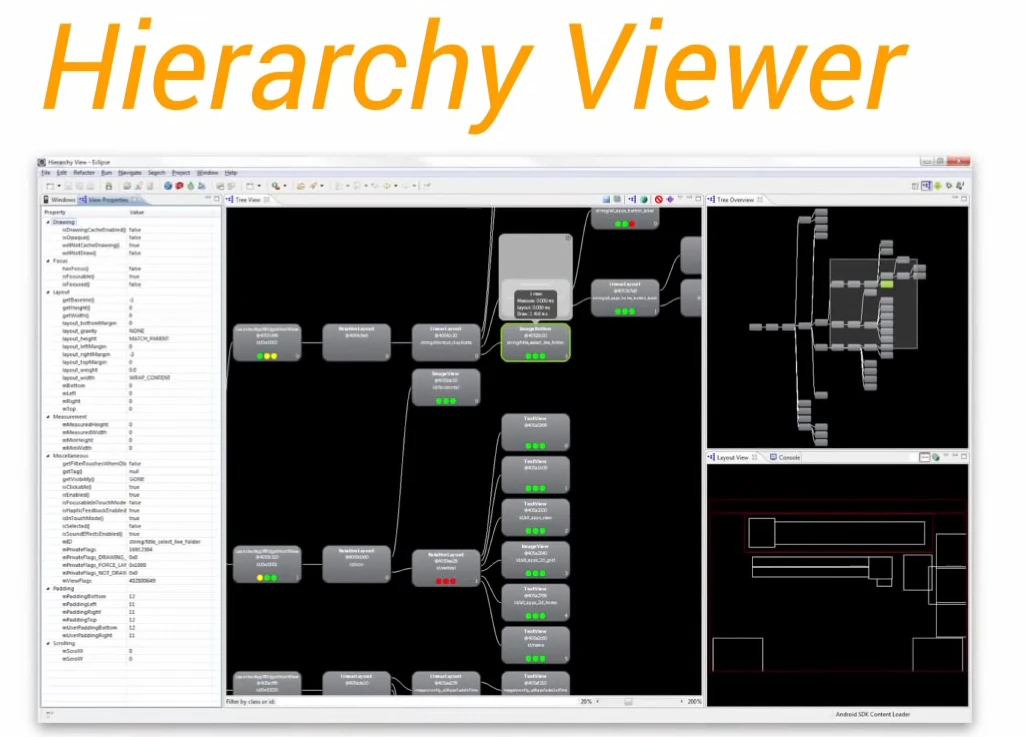
You can use Hierarchy Viewer to check if your view is too complex. If it is, you’re likely wasting time on overdraw and complex layouts.
Hierarchy Viewer is located in the Android Device Monitor. You can open it via Window -> Open Perspective -> Hierarchy View. While simple, it’s very effective. Spending time learning this tool pays off when troubleshooting issues. We’ll have a separate, more detailed tutorial on its usage.
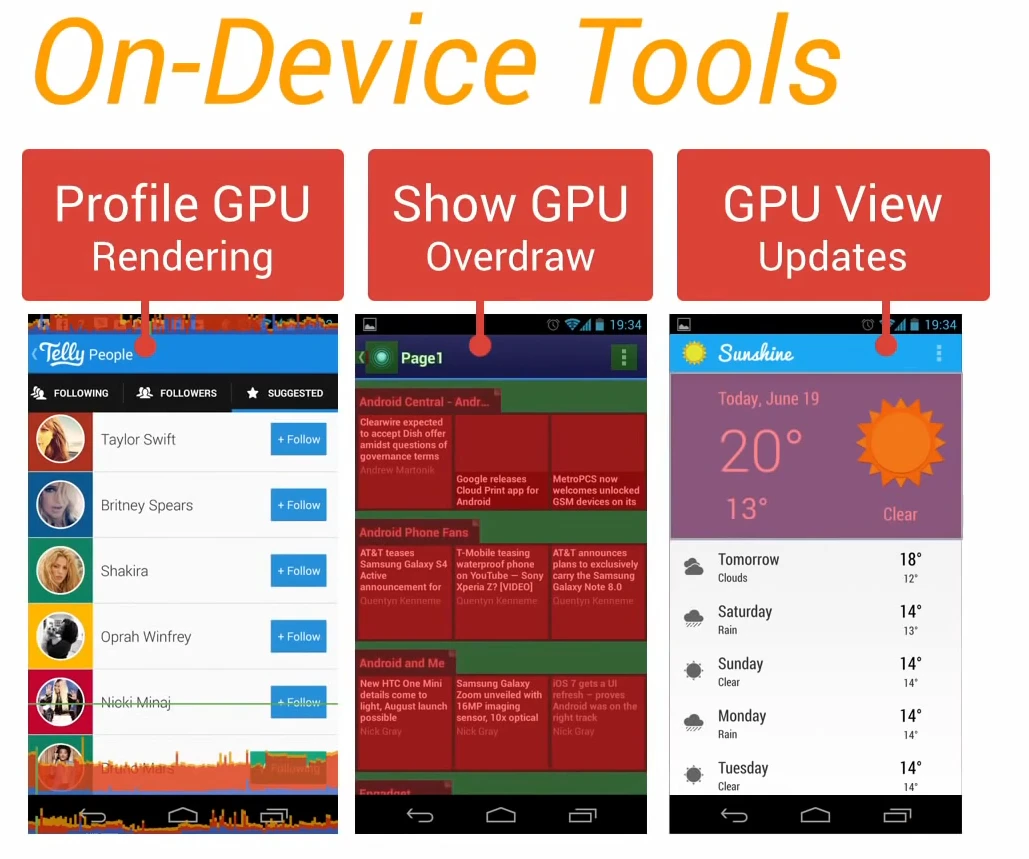
These options are in Settings -> Developer Options. Profile GPU Rendering and GPU Overdraw are quite important and will be covered in separate topics. Here’s a brief mention of GPU View Updates: it flashes views inside windows when drawn with the GPU. As Android versions progress, more drawing operations are handled by the GPU (see hardware acceleration documentation). When enabled, GPU-drawn areas are marked in red; areas not marked red are drawn by the CPU. This is also useful for checking the size of redrawn areas.
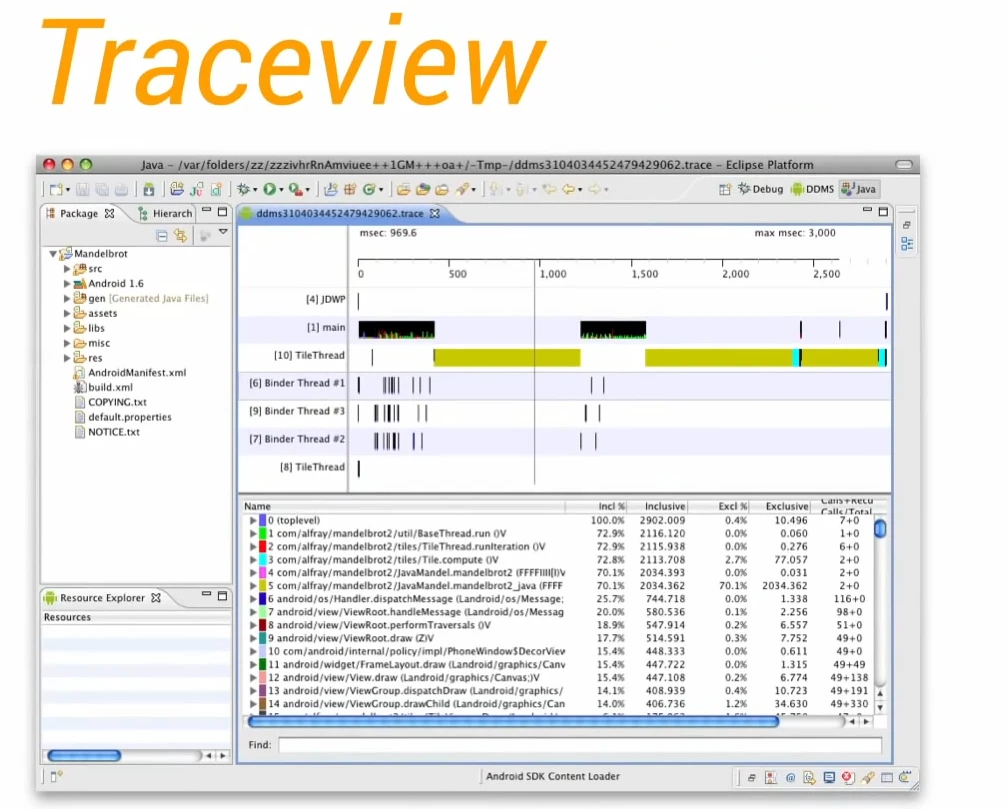
TraceView is an excellent tool for checking frame drops. While not mentioned in the video, it’s very important as it can precisely locate where time is spent in your code, down to individual function calls (both app and system functions). In modern Android Studio, TraceView has been improved and integrated into the Profiler, showing frame durations and function call stacks intuitively. Given its practicality, we’ll have a dedicated tutorial for it.
Perf Matters
Keep calm, profile your code, and always remember, Perf Matters.
Summary
This is the first video of the series. It looks at Render Performance from a high level, covering basic concepts, causes, and troubleshooting tools. It focuses on the “Discovery” and “Localization” phases of the performance optimization workflow. Specific solutions aren’t discussed yet, as there is no universal fix—every app has its own unique issues. This aligns with the series’ goal: empowering you with the tools and principles to find your own solutions.
About Me && Blog
Below is my personal intro and related links. I look forward to exchanging ideas with fellow professionals. “When three walk together, one can always be my teacher!”
- Blogger Intro
- Blog Content Navigation: A guide for my blog content.
- Curated Excellent Blog Articles - Android Performance Optimization Must-Knows
- Android Performance Optimization Knowledge Planet
One walks faster alone, but a group walks further together.