This is the first article in the series on using the MAT tool. This series consists of three articles, detailing how to use MAT to analyze memory issues, whether they are Java application memory issues or Android application memory issues:
- Android Memory Optimization (1) - Getting Started with MAT
- Android Memory Optimization (2) - Advanced MAT Usage
- Android Memory Optimization (3) - Opening Original Bitmap Images in MAT
Introduction to MAT
What is MAT?
MAT (Memory Analyzer Tool), a memory analysis tool based on Eclipse, is a fast and feature-rich JAVA heap analysis tool. It helps us find memory leaks and reduce memory consumption. Using the memory analysis tool to analyze numerous objects, quickly calculate the size occupied by objects in memory, see who is preventing the garbage collector from reclaiming, and visually view the objects that may cause this result through reports.
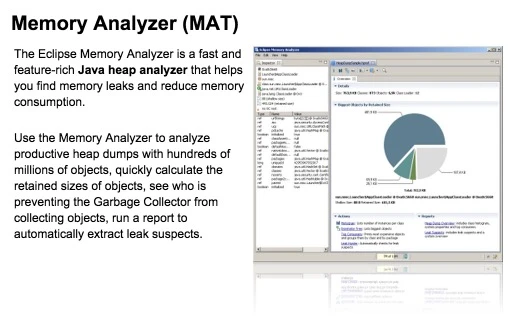
Of course, MAT also has an independent version that doesn’t rely on Eclipse, but this version requires converting the file generated by DDMS before it can be opened in the standalone version of MAT when debugging Android memory. However, the Android SDK already provides this Tool, so it is also very convenient to use.
Download and Installation of MAT Tool
Here is the download address for MAT: https://eclipse.org/mat/downloads.php. There are three choices available when downloading:
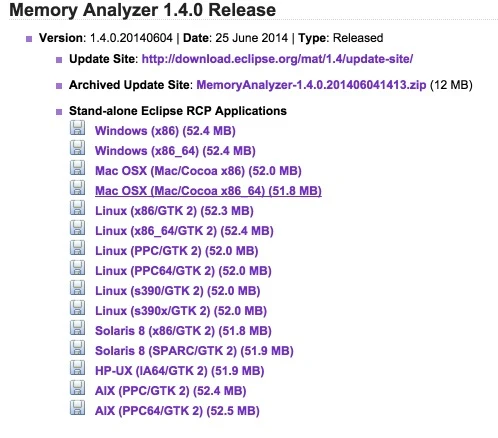
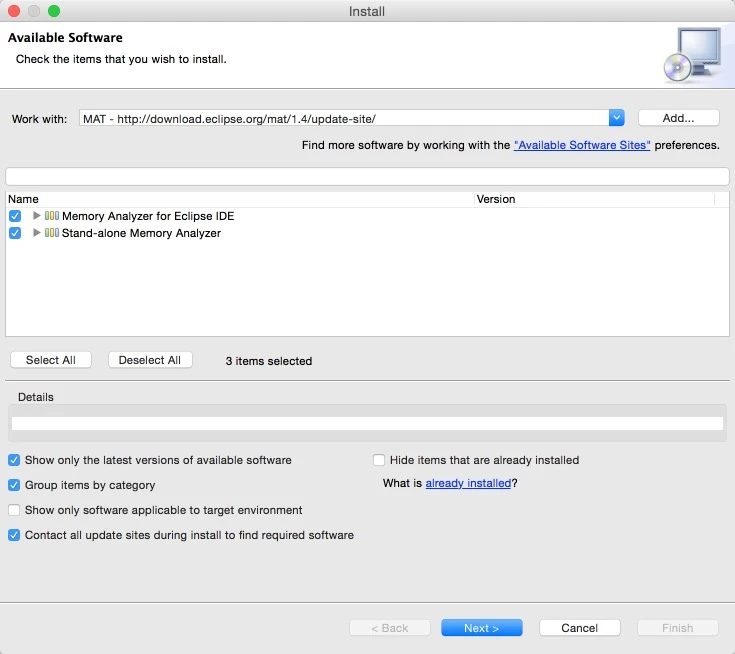
- Update Site: This method will be followed by a URL: such as http://download.eclipse.org/mat/1.4/update-site/ . Students who have installed Eclipse plugins should know that just copy this URL to the Install New Software of the corresponding Eclipse to download online.
- Archived Update Site: The installation location of this method is similar to the previous one, except that the first one is an online download, and this one uses an offline package for updating. The disadvantage of this method is that when the plugin is updated, the offline package needs to be re-downloaded, while the first method can be updated online.
- Stand-alone Eclipse RCP Applications: This method uses MAT as an independent tool and no longer relies on Eclipse. It is suitable for students who do not use Eclipse but use Android Studio. The troublesome part of this method is that the file exported by DDMS needs to be converted before it can be opened in MAT.
After downloading and installing, you can use MAT for actual operations.
Common Bad Code Causing Memory Leaks in Android (Java)
Android Memory
Before using the MAT tool, one must have a basic understanding of Android’s memory allocation method, be sensitive to code that easily causes memory leaks, and troubleshooting memory leaks at the code level contributes to memory usage.
Android is mainly used in embedded devices, and due to some well-known limitations, embedded devices usually do not have high configurations, especially memory is relatively limited. If the code we write has too many improper uses of memory, it will inevitably make our device run slowly or even crash. In order for Android applications to run safely and quickly, each Android application uses a dedicated Dalvik virtual machine instance to run. It is hatched by the Zygote service process, meaning each application runs in its own process. On the one hand, if a memory leak problem occurs during the running of the program, it will only cause its own process to be killed without affecting other processes (if system processes like system_process have problems, it will cause the system to restart). On the other hand, Android allocates different memory usage limits for different types of processes. If the memory used by the application process exceeds this limit, it will be regarded as a memory leak by the system and killed.
Common Cases of Improper Memory Usage
Cursor Not Closed After Querying Database
Description:
The program often performs database query operations, but there are often cases where the Cursor is not closed after use. If our query result set is relatively small, the memory consumption is not easily detected. Memory problems will only reappear under long-term large-scale operations. This will bring difficulties and risks to future testing and troubleshooting.
Sample Code:
1 | Cursor cursor = getContentResolver().query(uri ...); |
Corrected Sample Code:
1 | Cursor cursor = null; |
`
Not Using Cached convertView When Constructing Adapter
Description: Taking constructing BaseAdapter of ListView as an example, the BaseAdapter provides the method:
1 | public View getView(int position, View convertView, ViewGroup parent) |
To provide the view object needed for each item to ListView. Initially, ListView will instantiate a certain number of view objects from BaseAdapter based on the current screen layout, and at the same time, ListView will cache these view objects. When scrolling up the ListView, the view object of the list item originally located at the top will be recycled and then used to construct the newly appearing list item at the bottom. This construction process is completed by the getView() method. The second parameter View convertView of getView() is the cached view object of the list item (if there is no view object in the cache during initialization, convertView is null).
From this, we can see that if we do not use convertView but re-instantiate a View object in getView() every time, it wastes resources and time, and will also make memory usage larger and larger. The process of ListView recycling the view object of list item can be viewed in: android.widget.AbsListView.java –> void addScrapView(View scrap) method.
Sample Code:
1 | public View getView(int position, View convertView, ViewGroup parent) { |
`
Corrected Sample Code:
1 | public View getView(int position, View convertView, ViewGroup parent) { |
Regarding the use and optimization of ListView, you can refer to these two articles:
Bitmap Object Not Calling recycle() to Release Memory When Not in Use
Description: Sometimes we manually operate Bitmap objects. If a Bitmap object occupies a lot of memory, when it is no longer used, you can call the Bitmap.recycle() method to reclaim the memory occupied by the pixels of this object.
In addition, regarding Android development in the latest versions, using the following method can also release the memory occupied by this Bitmap.
1 | Bitmap bitmap ; |
Releasing References to Objects
Description: This situation is troublesome to describe, let’s take two examples to illustrate.
Example A:
Suppose we have the following operation
1 | public class DemoActivity extends Activity { |
We have a member variable obj. In operation(), we hope to post the operation of processing the obj instance to the MessageQueue of a certain thread. In the code above, even if the thread where mHandler holds finishes using the object referenced by obj, this object will still not be garbage collected because DemoActivity.obj still holds a reference to this object. So if this object is no longer used in DemoActivity, the reference to the object can be released at the location of [Mark], and the code can be modified to:
1 | public void operation() { |
Example B:
Suppose we want to listen to the telephone service in the system to obtain some information (such as signal strength, etc.) on the lock screen (LockScreen), we can define a PhoneStateListener object in the LockScreen and register it to the TelephonyManager service. For the LockScreen object, a LockScreen object is created when the lock screen interface needs to be displayed, and the LockScreen object is released when the lock screen interface disappears.
However, if we forget to cancel the PhoneStateListener object we registered previously when releasing the LockScreen object, it will cause the LockScreen to be unable to be garbage collected. If the lock screen interface is continuously displayed and disappears, it will eventually cause OutOfMemory due to a large number of LockScreen objects being unable to be recycled, causing the system_process process to hang.
In short, when a shorter lifecycle object A is held by a longer lifecycle object B, the reference to A should be cleared in B when A’s lifecycle ends.
Others
The most typical situation where resources need to be released in Android applications involves the Activity lifecycle, where resources need to be appropriately released in the onPause(), onStop(), and onDestroy() methods. Since this situation is basic, it will not be explained in detail here. You can check the official documentation on the Activity lifecycle to clarify when to release which resources.
Some other examples will be added in supplementary versions.
Using MAT for Memory Debugging
Obtaining HPROF File
HPROF file is a file that MAT can recognize. HPROF file stores the memory snapshot of the java process at a specific point in time. There are different formats for storing this data, generally containing the situation of java objects and classes in the heap when the snapshot was triggered. Since the snapshot is just a momentary thing, the heap dump cannot contain information such as when and where (in which method) an object was allocated.
This file can be exported using DDMS:
- There is a row of buttons above Devices in DDMS. After selecting a process (that is, selecting the package name of the application you want to debug in the list listed under Devices), click the Dump HPROF file button:
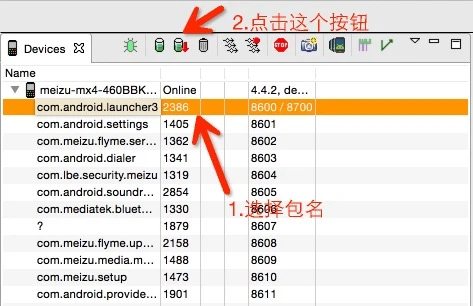
After confirming the storage path and saving, you can get the HPROF file of the corresponding process. The eclipse plugin can complete the above work in one click. Just click the Dump HPROF file icon, and the MAT plugin will automatically convert the format and open the analysis results in eclipse. Eclipse also has a dedicated Memory Analysis view.
- After getting the corresponding file, if the Eclipse plugin is installed, switch to the Memory Analyzer view. If installed independently, use the tool that comes with the Android SDK (hprof-conv located in sdk/platform-tools/hprof-conv) for conversion.
1 | hprof-conv xxx.xxx.xxx.hprof xxx.xxx.xxx.hprof |
The converted .hprof file can be opened using the MAT tool.
Introduction to MAT Main Interface
Here we are not introducing the main interface of the MAT tool itself, but the OverView interface displayed after importing a file.
- Open the converted hprof file:
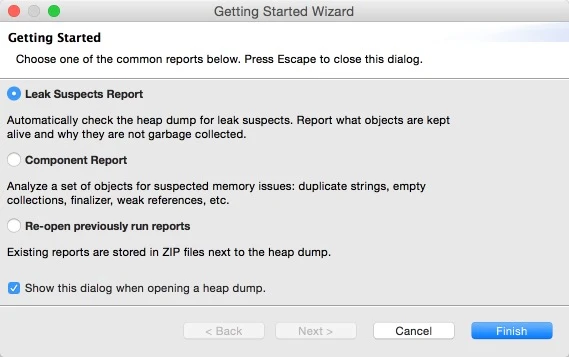
If the first one is selected, a report will be generated. This is fine.
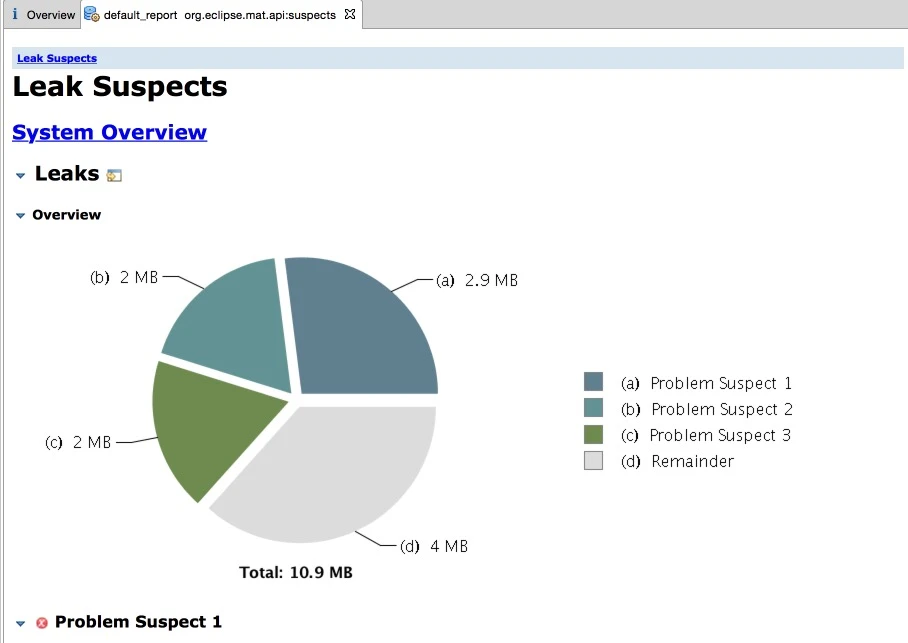
Select OverView interface:
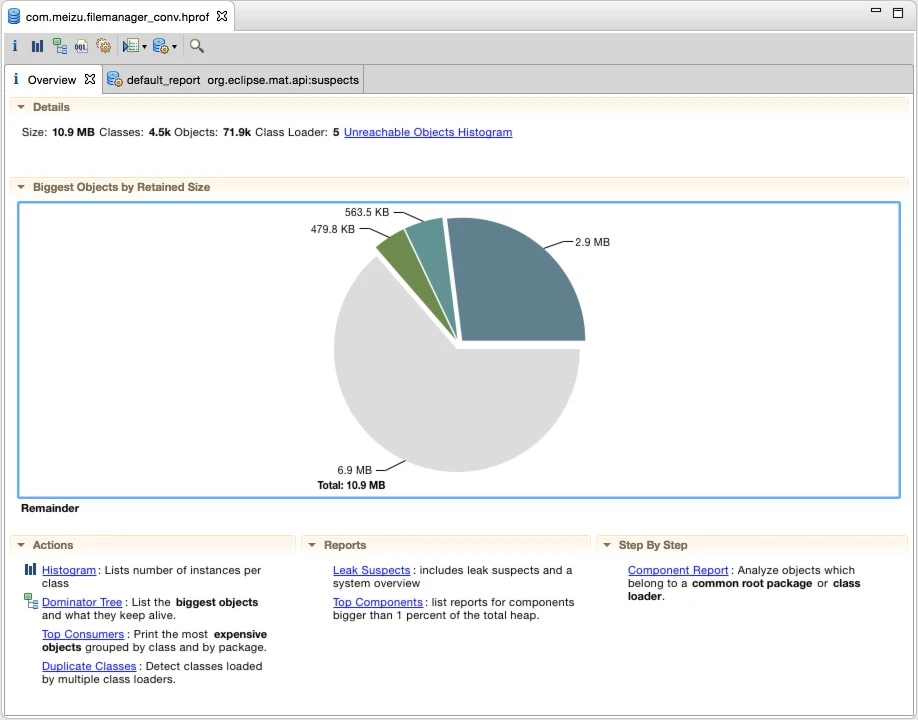
We need to pay attention to the Actions area below
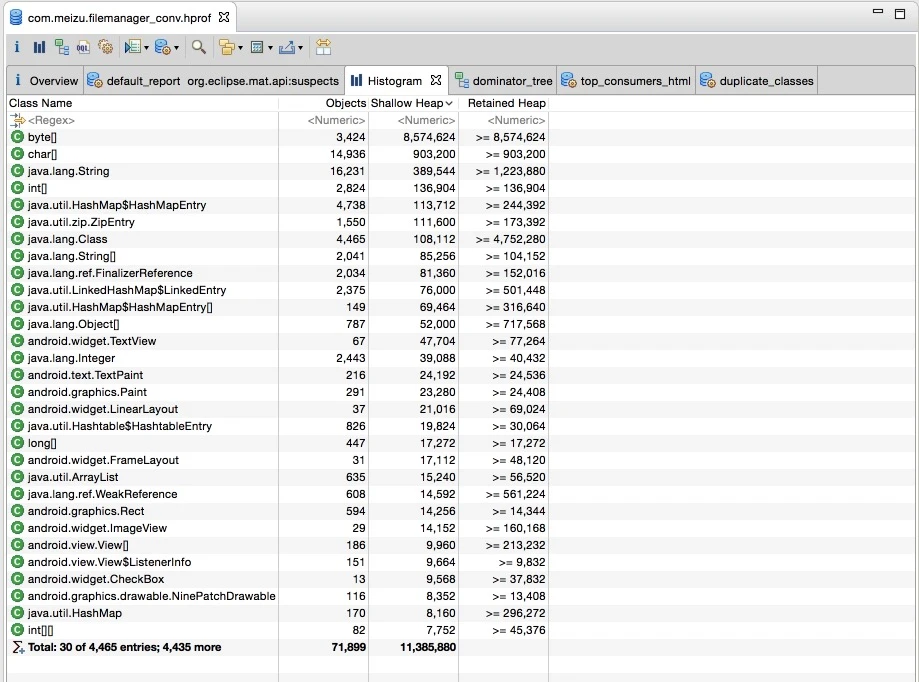
Histogram: Lists objects in memory, the number of objects, and size
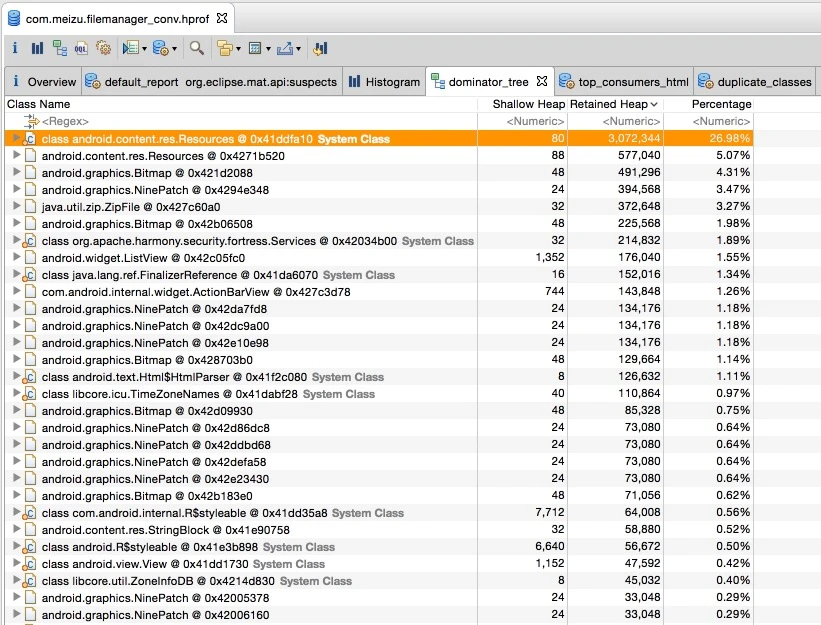
Dominator Tree: Lists the largest objects and the Objects depending on them for survival (size is sorted by Retained Heap)
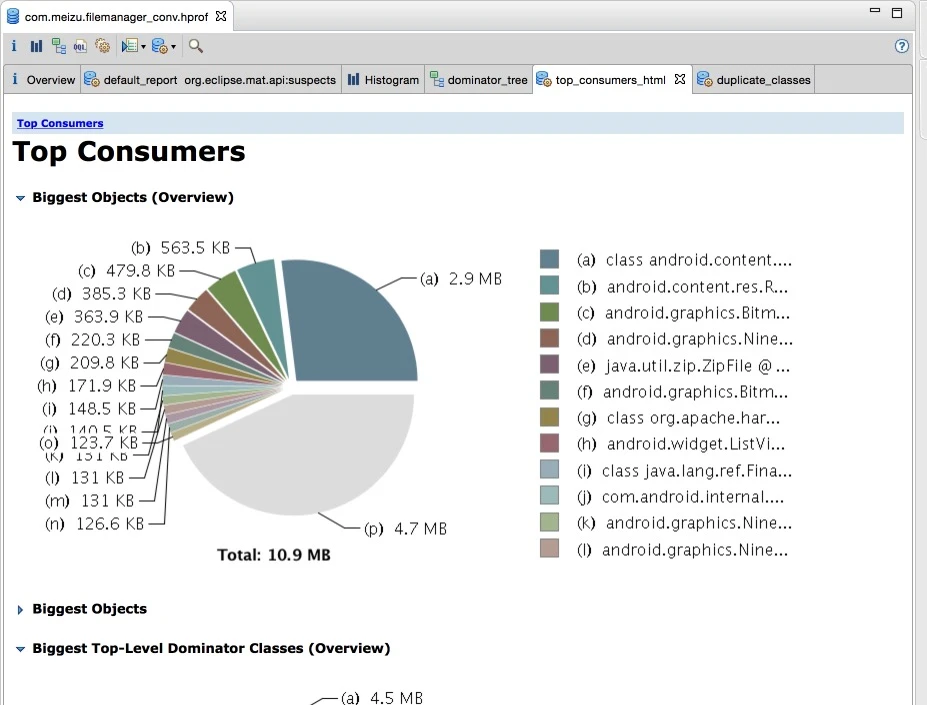
Top Consumers: Lists the largest objects graphically
Duplicate Class: Analyze the cause of leakage automatically via MAT
Generally, Histogram and Dominator Tree are the most commonly used.
Introduction to Some Concepts in MAT
To understand MAT’s list information, the concepts of Shallow heap, Retained Heap, and GC Root must be understood.
3.3.1 Shallow heap
Shallow size is the size of the memory occupied by the object itself, excluding the objects it references.
- The Shallow size of a regular object (non-array) is determined by the number and type of its member variables.
- The shallow size of an array is determined by the type of array elements (object type, basic type) and the array length.
Because unlike C++ objects which can store a large amount of memory themselves, java object members are all references. The real memory is on the heap, appearing as a pile of native byte[], char[], int[], so if we only look at the memory of the object itself, the quantity is very small. So we see that the Histogram chart is sorted by Shallow size, and the first and second places are byte, char.
3.3.2 Retained Heap
The concept of Retained Heap represents the heap size occupied by all objects (including those recursively released) that would be released due to the release of an object reducing references if that object were released. Thus, if a member of an object instantiates a large chunk of int array, that int array can also be calculated into this object. Relative to shallow heap, Retained heap can more accurately reflect the actual size occupied by an object (because if the object is released, the retained heap can be released).
What needs to be said here is that Retained Heap is not always so effective. For example, I instantiate a chunk of memory in A and assign it to a member variable of A. At this time, I also let B point to this memory. At this time, because both A and B refer to this memory, when A is released, this memory will not be released. So this memory will not be calculated in the Retained Heap of A or B. To correct this, the Leading Object (such as A or B) in MAT is not necessarily just one object, but can also be multiple objects. At this time, the Retained Set of the combination (A, B) includes that large memory. Corresponding to the MAT UI, in the Histogram, you can select Group By class, superclass or package to select this group.
To calculate Retained Memory, MAT introduced the Dominator Tree. Suppose object A references B and C, and B and C both reference D (a diamond shape). At this time, to calculate Retained Memory, A’s includes A itself and B, C, D. Because B and C jointly reference D, their Retained Memory is only themselves. D of course is also just itself. I think it is to speed up the calculation that MAT changed the object reference graph into an object reference tree. In this example, the tree root is A, and B, C, D are its three sons. B, C, D no longer have a mutual relationship. Changing the reference graph into a reference tree makes calculating Retained Heap very convenient, and display is also very convenient. Corresponding to the MAT UI, in the dominator tree view, the shallow heap and retained heap of each object are displayed. Then you can take that node as the tree root and refine step by step to see where the retained heap is actually used. What needs to be said is that this conversion from graph to tree indeed facilitates memory analysis, but sometimes it can be confusing. Originally object B is a member of object A, but because B is also referenced by C, B is not under A in the tree, but likely at the same level.
To correct this, right-click in MAT and choose between with outgoing references and with incoming references in List objects. This corresponds to the concept of a real reference graph.
- outgoing references: Indicates the out-nodes of the object (objects referenced by this object).
- incoming references: Indicates the in-nodes of the object (objects referencing this object).
To better understand Retained Heap, an example is cited below for illustration:
Treat objects in memory as nodes in the figure below, and objects reference each other. There is a special node GC Roots here, which is the starting point of the reference chain:
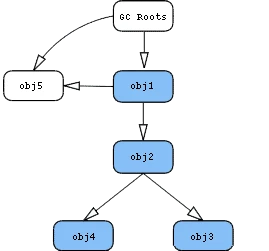
Starting from obj1, the blue nodes in the above figure represent objects that can only be accessed directly or indirectly through obj1. Because obj3 can be accessed via GC Roots, obj3 in the left figure is not a blue node; while in the right figure it is blue because it is already included in the retained set.
So for the left figure, the retained size of obj1 is the sum of shallow sizes of obj1, obj2, obj4;
The retained size of the right figure is the sum of shallow sizes of obj1, obj2, obj3, obj4.
The retained size of obj2 can be calculated in the same way.
GC Root
When GC finds that an object cannot be accessed through any reference chain, the object is recycled. The term GC Roots is exactly the starting point for analyzing this process. For example, the JVM itself ensures the reachability of objects (so the JVM is GC Roots), so GC Roots ensures object reachability in memory in this way. Once unreachable, it is recycled. Usually, GC Roots is an object on the call stack of the current thread (such as method parameters and local variables), or the thread itself, or a class loaded by the system class loader, and active objects retained by native code. So GC Roots is a sharp weapon for analyzing why objects still survive in memory.
Some Useful Views in MAT
Thread OvewView
Thread OvewView allows viewing the Thread information of this application: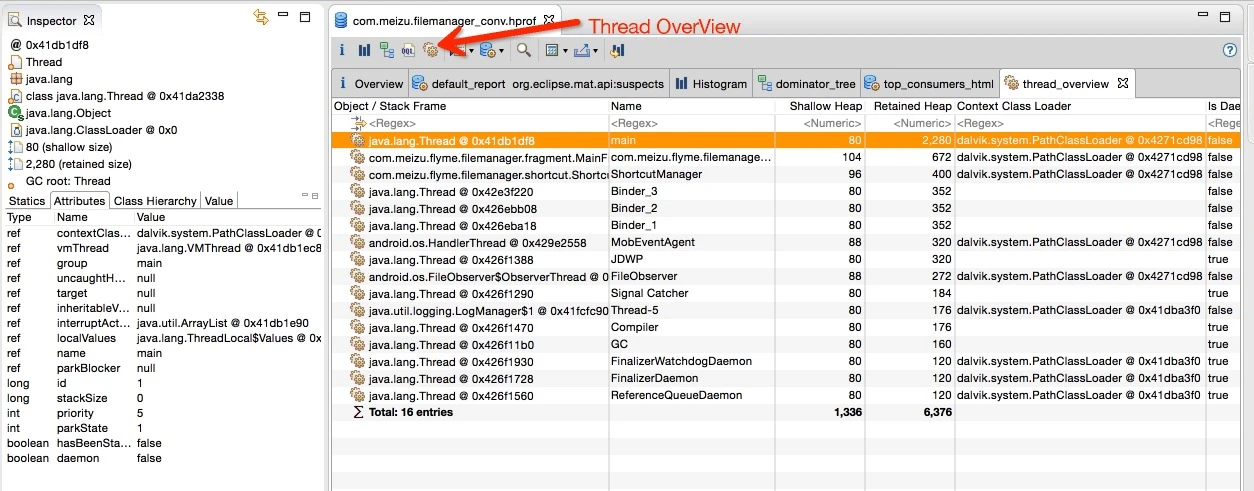
Group
In the Histogram and Dominator Tree interfaces, you can choose to display the results in another Group way (default is Group by Object). Switching to Group by package allows better viewing of which package’s classes occupy large memory, and it is also easy to locate your own application.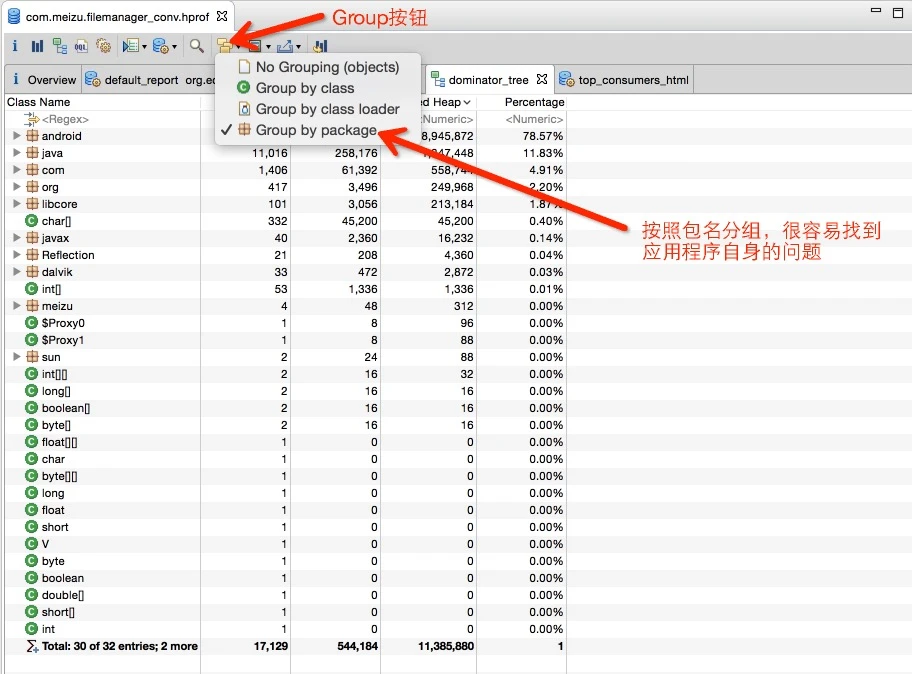
Path to GC Root
On a certain entry in the Histogram or Dominator Tree, right-click to view its GC Root Path: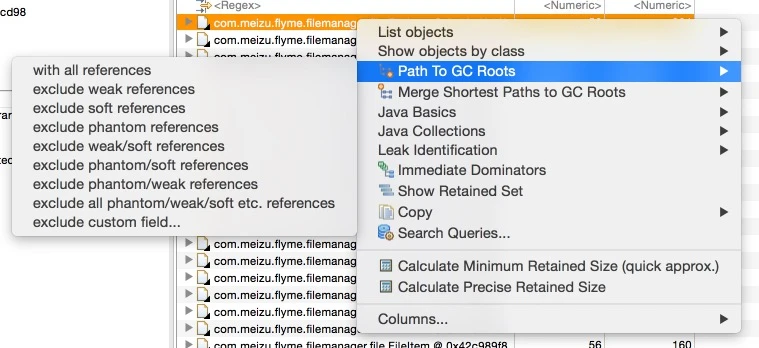
The reference rules of Java should also be explained here:
From strongest to weakest, different reference (reachability) levels reflect the life cycle of objects.
- Strong Ref: The code we usually write is Strong Ref, corresponding to strong reachability. The object is only recycled when strong reachability is removed.
- Soft Ref: Corresponds to soft reachability. As long as there is enough memory, the object is kept until memory is tight and there is no Strong Ref before recycling the object. Generally used to implement caching, implemented via the java.lang.ref.SoftReference class.
- Weak Ref: Weaker than Soft Ref. When no Strong Ref is found, the object is recycled immediately without waiting for memory to be tight. Implemented via java.lang.ref.WeakReference and java.util.WeakHashMap classes.
- Phantom Ref: No object is kept in memory at all. You can only use Phantom Ref itself. Generally used for special cleanup processes after entering the finalize() method, implemented via java.lang.ref.PhantomReference.
Click Path To GC Roots –> with all references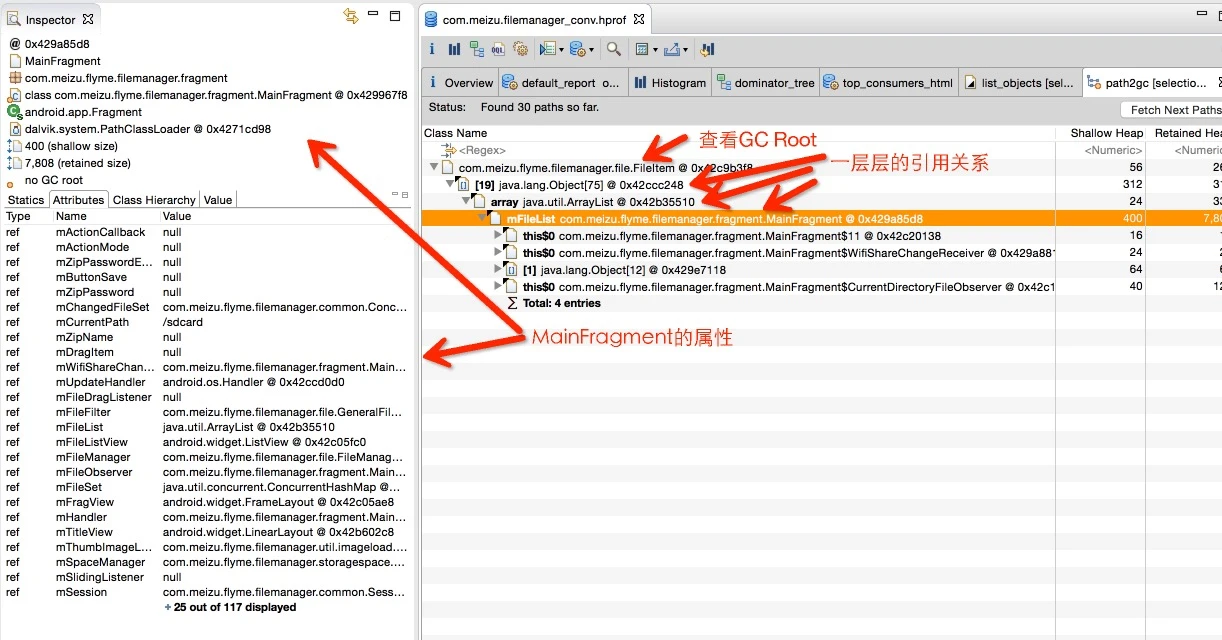
Reference Documents
About Me && Blog
Below are personal introduction and related links. I hope to communicate more with everyone in the industry. If three people walk together, there must be one who can be my teacher!
- Blogger Personal Introduction: There are personal WeChat and WeChat group links inside.
- This Blog Content Navigation: A navigation of personal blog content.
- Excellent blog articles organized and collected by individuals - A must-know for Android efficiency optimization: Everyone is welcome to recommend themselves and recommend others (WeChat private chat is fine)
- Android Performance Optimization Knowledge Planet: Welcome to join, thanks for your support~
One person can go faster, a group of people can go further